As Ireland looks to lift the last of its restrictions and move into, hopefully, a post-pandemic phase, it is important to remember that while the pandemic may be ending in much of the world, the virus has not been eradicated - medical opinion seems to indicate that COVID-19 is here to stay and will become endemic[1] in our populations. New variants may yet emerge which can evade the existing vaccines or challenge our immune defences in other ways. In Ireland and much of the developed world, the prospect of returning to “normality” is real and imminent but we should not be complacent, either as individuals or as actuaries. The risk of another pandemic or of the long-term effects of COVID-19 changing our view of mortality is something we all need to think about.
In this post we present the results of our most recent analysis of experience in Ireland. Our updated results are based on data from RIP.ie to 1 October 2021 and all data processing and analysis has been undertaken in line with the approach outlined in our earlier blogs.
Analysis of deaths in Ireland
The chart below shows the number of deaths reported through RIP.ie in each month of 2020 (dark blue) and 2021 (green) against the average number reported for the same month over 2015 – 2019 (light blue). Confidence intervals of two standard deviations are included in the grey bars for perspective.
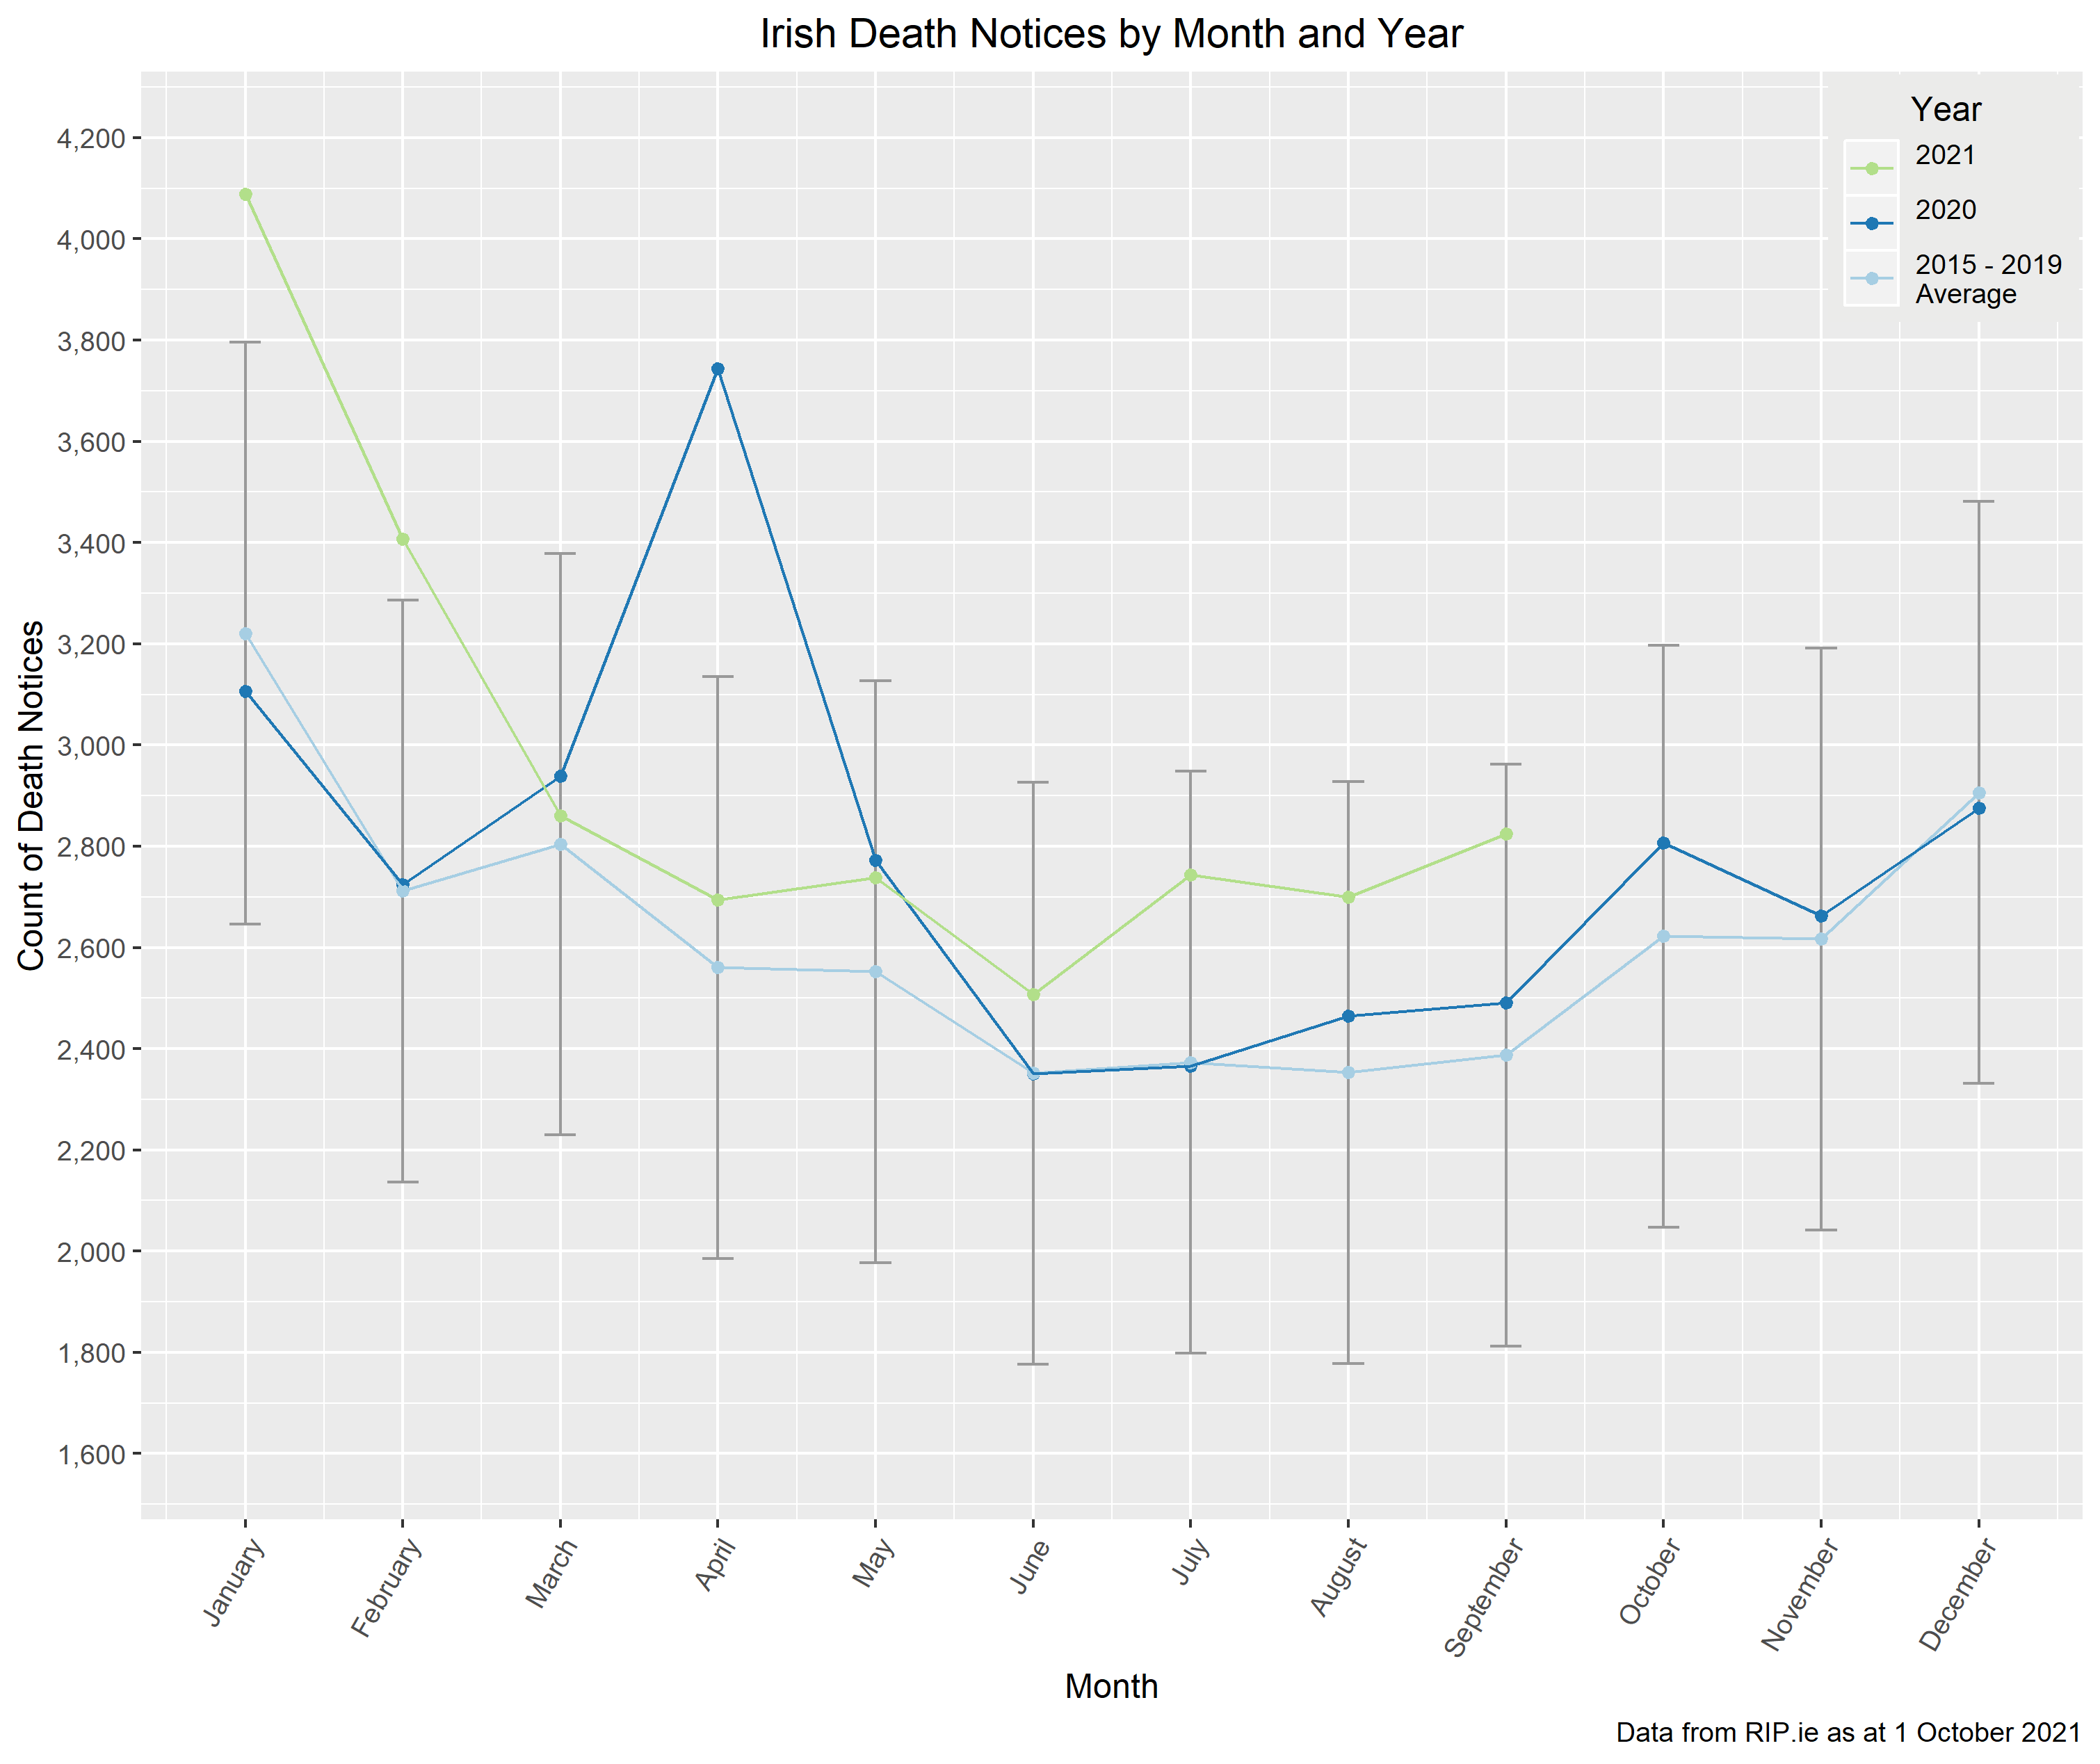
The number of deaths in August was above average by broadly the same amount as July. September saw an increase in the number of deaths which was less pronounced than the increase observed from June to July but more than the average increase for September. While a single month with a small increase is not necessarily indicative of an emerging trend, we can see that October is typically the start of the heavier winter mortality rate so September already showing an increase could be indicative of a heavier than normal period of winter mortality to come.
A number of academics and research bodies have indicated that COVID-19 is expected to become endemic so it is reasonable to expect that, in the short to medium term at least, mortality may remain higher than the recent historic average although presumably there will be some offset with seasonal flu deaths as there is significant overlap in the most vulnerable populations in each case.
Analysis by gender
The chart below shows the percentage of death notices that were male in each month of 2020 (dark blue) and 2021 (green) against the corresponding averages from 2015 – 2019 (light blue) and confidence intervals.
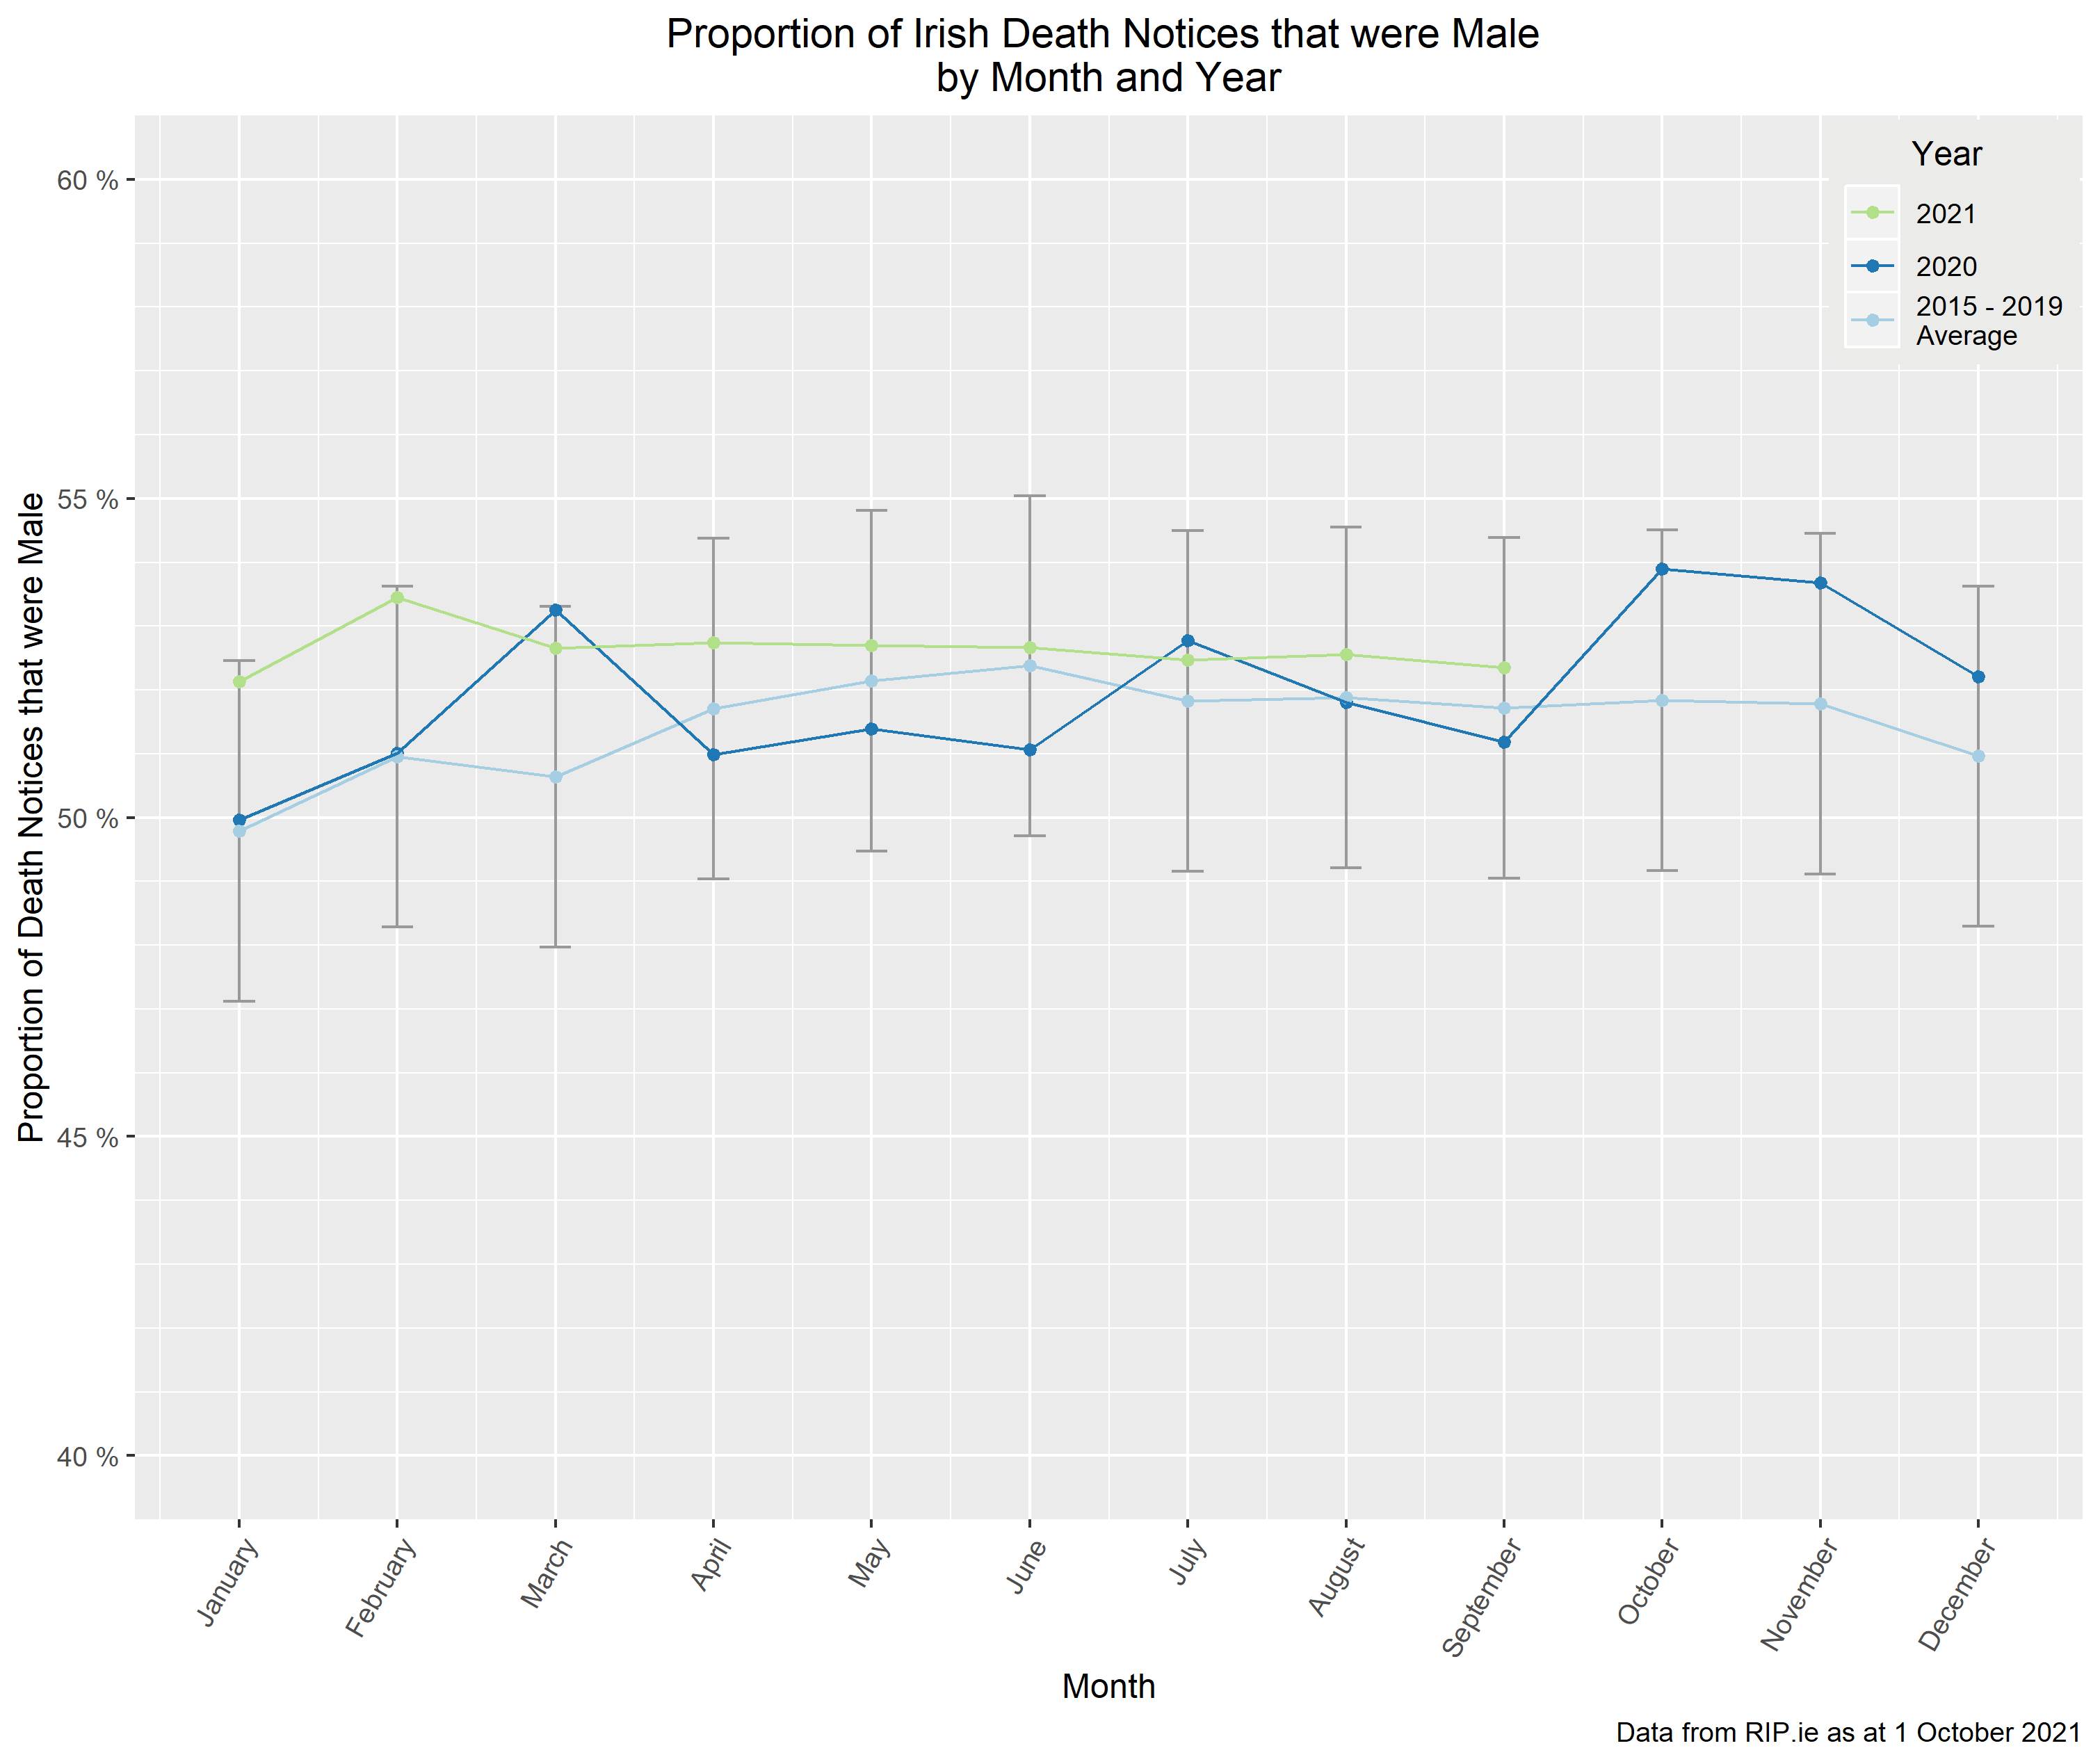
In our previous post, we noted that the male bias which had been a feature of the second-wave, had settled at a level close to the average for the time of year. August and September have maintained this trend as while the proportion of deaths which are male is slightly higher than the average, it is not significantly higher. This may indicate a return to “normal” levels with the difference being simple annual variation. However, the fact that the proportion of deaths which are male has been consistently higher than the average, rather than showing variation in both directions (as 2020 did), may indicate an ongoing, albeit lower level, of male bias in the deaths observed. It is too early to tell whether this is a short-term residual effect which will be diluted as we move into the post-pandemic period or whether the “normal” gender bias in deaths has shifted in the medium to long term. It is another aspect the actuarial profession will need to consider as it gets to grips with how to allow for the effects of COVID-19 in future mortality assumptions.
County-level gender analysis
The above analysis was further examined at county level, focusing on both excess mortality and the proportion of male reported deaths from the start of the pandemic through to the end of September 2021. The following map shows the movement in the proportion of reported deaths which were male, with the excess mortality for each county in the corresponding table.

As discussed in previous posts, the experience observed in Donegal appears to be caused by a change in the way RIP.ie is used in the county rather than actual experience and therefore, we have excluded it from the table. Similar features have not been observed in the other counties, so the above breakdown remains our best view of the county-level impact at the current time.
Excess mortality – population adjusted
Consistent with our approach in prior posts, the analysis above has not been adjusted for changes in the population over time. However, using the population-adjustment methodology presented in post 12 and used again in our most recent post (post 15), the chart below shows excess mortality measured against the 2015-2019 average and against the population adjusted average.
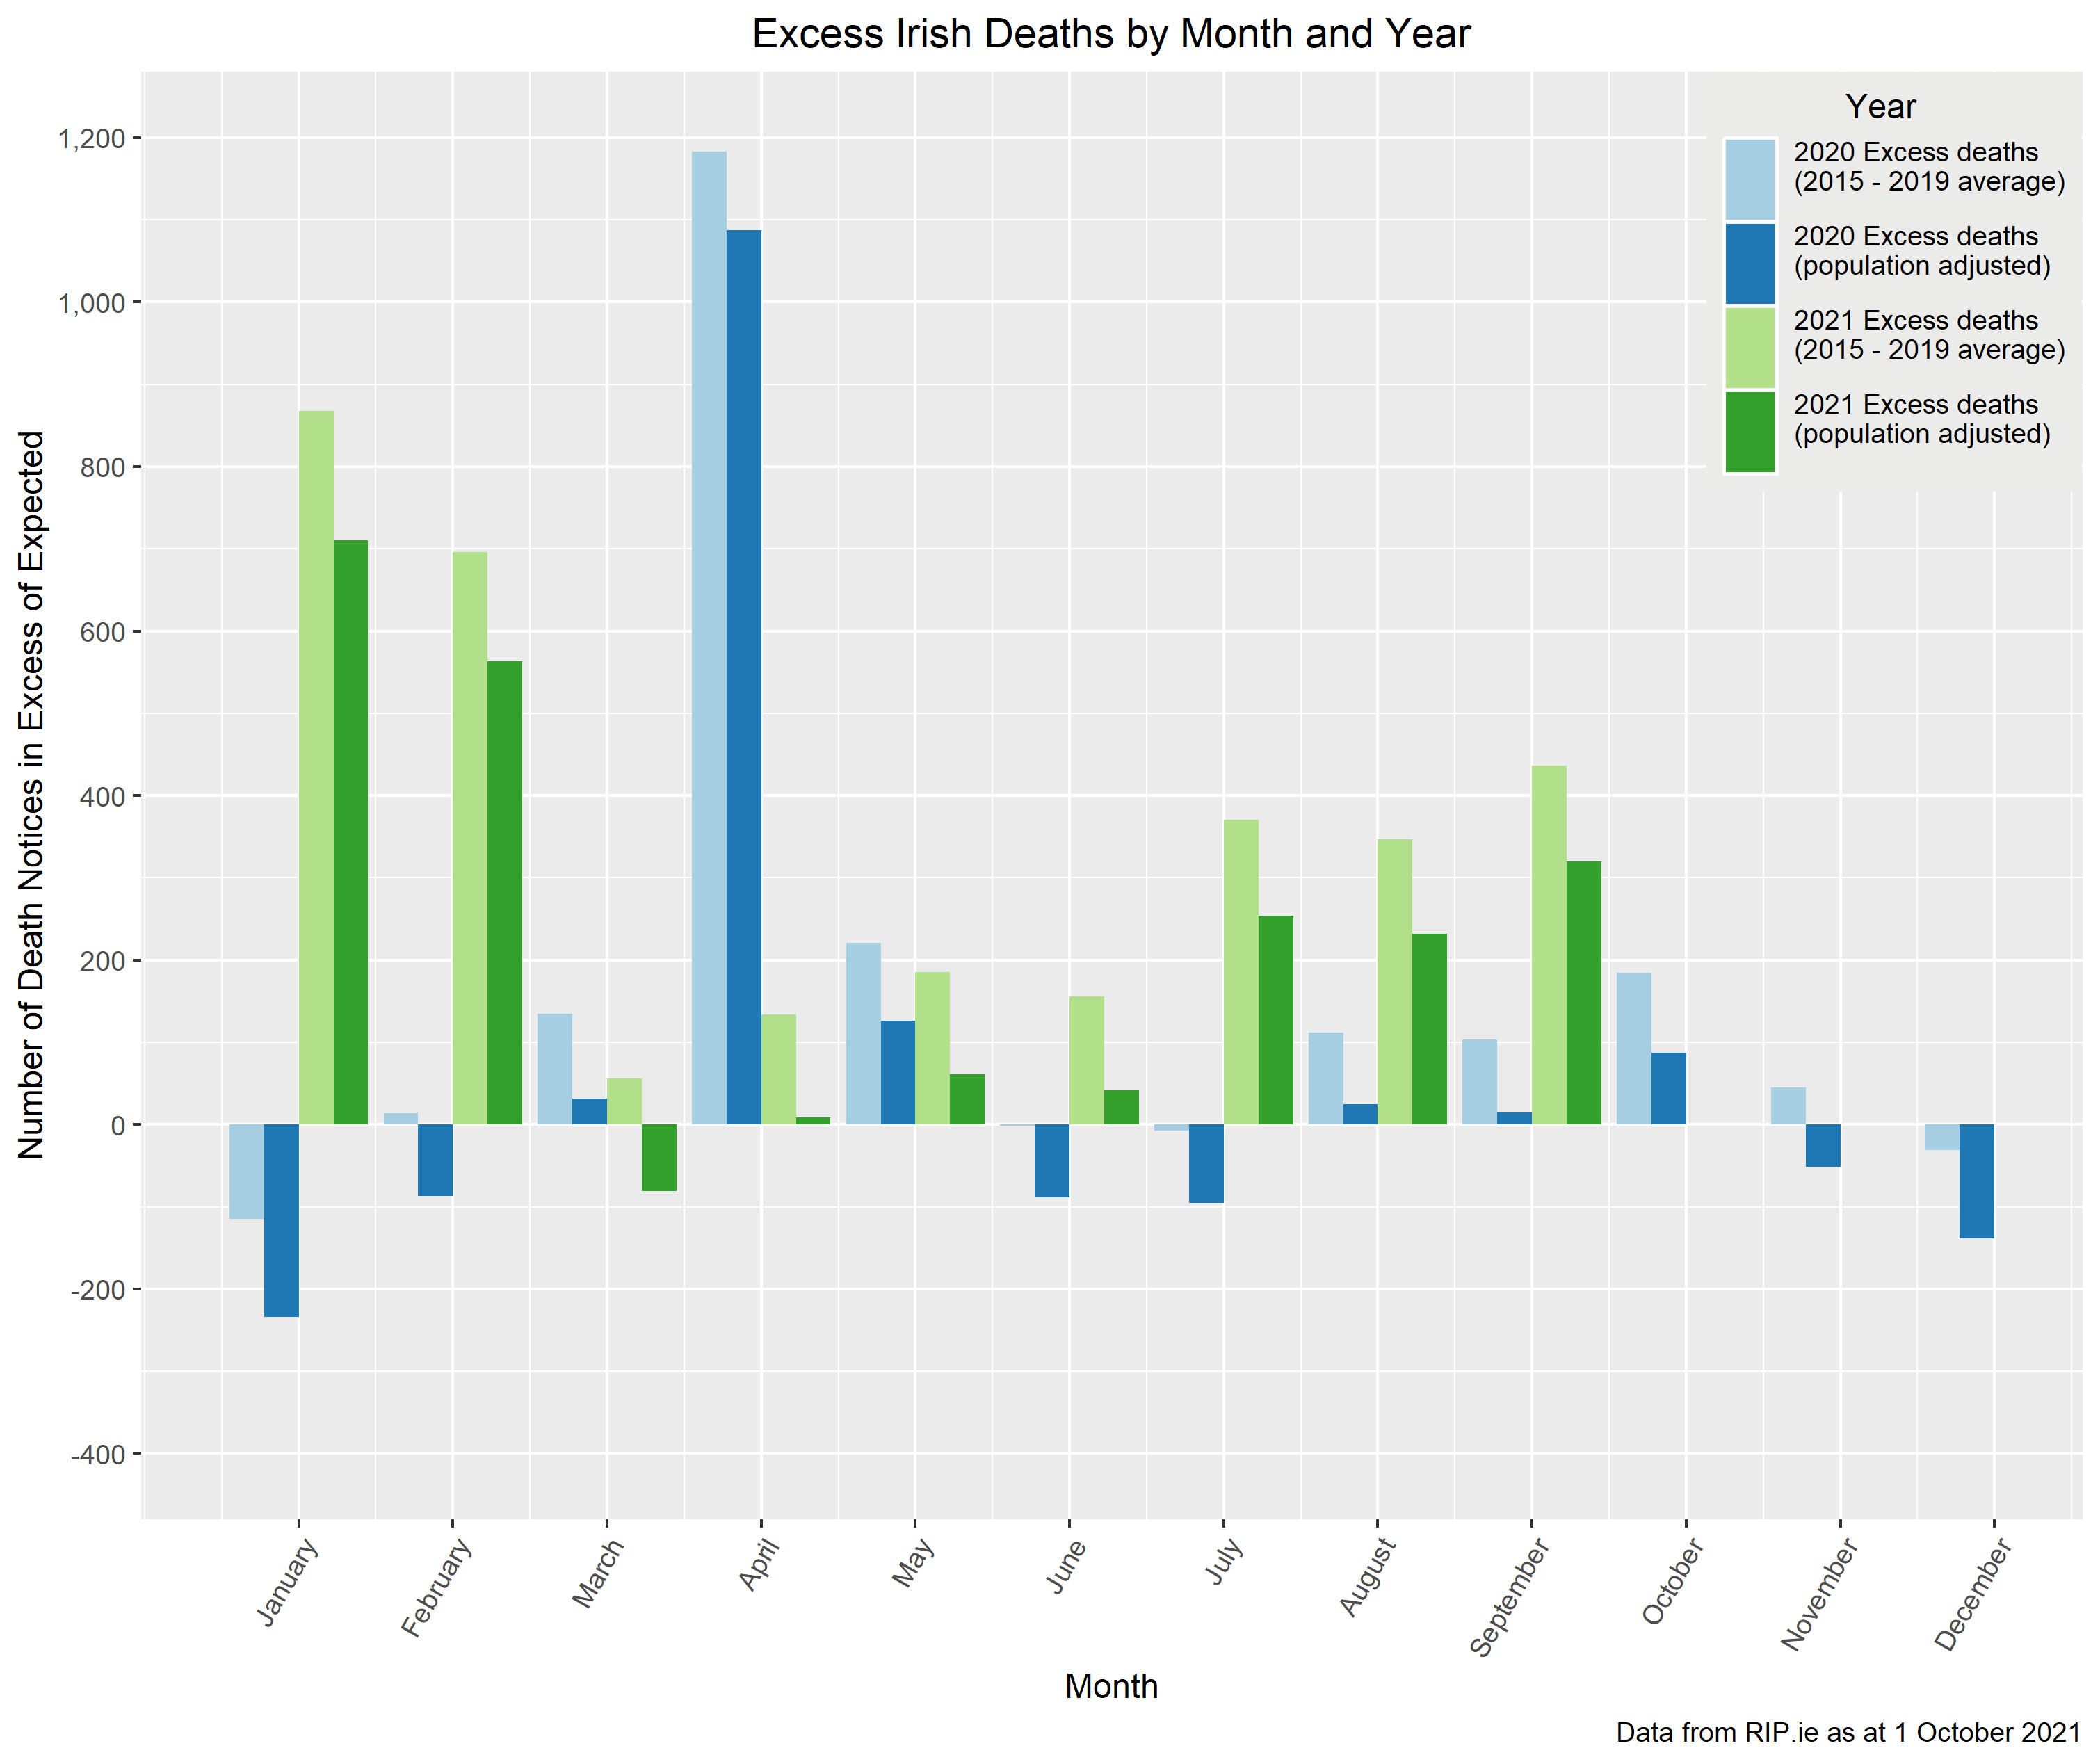
Total excess mortality in 2020 is 1,857 when measured against our standard 5-year average but reduces to 692 when measured against the population adjusted 5-year average. The corresponding total figures for the first 7 months of 2021 are 3,248 and 2,110. However, as discussed in the prior posts regarding this methodology, the lower excess mortality figures implied by the population-adjusted analysis do not allow for the offsetting impact of mortality improvements over the same period, so the true excess mortality may fall between these counts.
COVID-19 Action Group
The views of this article do not necessarily reflect the views of the Society of Actuaries in Ireland.