With winter setting in and “lockdown 2” being eased for the festive season, we expect to see an increasing number of COVID-19 cases over the coming weeks. Now is a good time to look at where we are and how things have changed over the year.
In our previous post, we considered excess mortality up to September 2020 when it appeared likely we were entering a second wave of infections and deaths. Since then, it has become clear that we are having a second wave, albeit less significant presumably because of public health measures which were introduced to stop the spread of COVID-19 and have evolved since the onset of the virus. The Government response was swift with Ireland being the first EU country to re-enter full lockdown in October 2020. So how has all this impacted excess mortality?
In this post we present our updated analysis including October and November data from RIP.ie. All data processing and analysis has been undertaken in line with the approach outlined in our earlier blogs.
Analysis of deaths in Ireland
The chart below shows the number of deaths reported through RIP.ie in each month of 2020 against the average number reported for the same month over 2015 – 2019. Confidence intervals of two standard deviations are included in the grey bars for perspective.
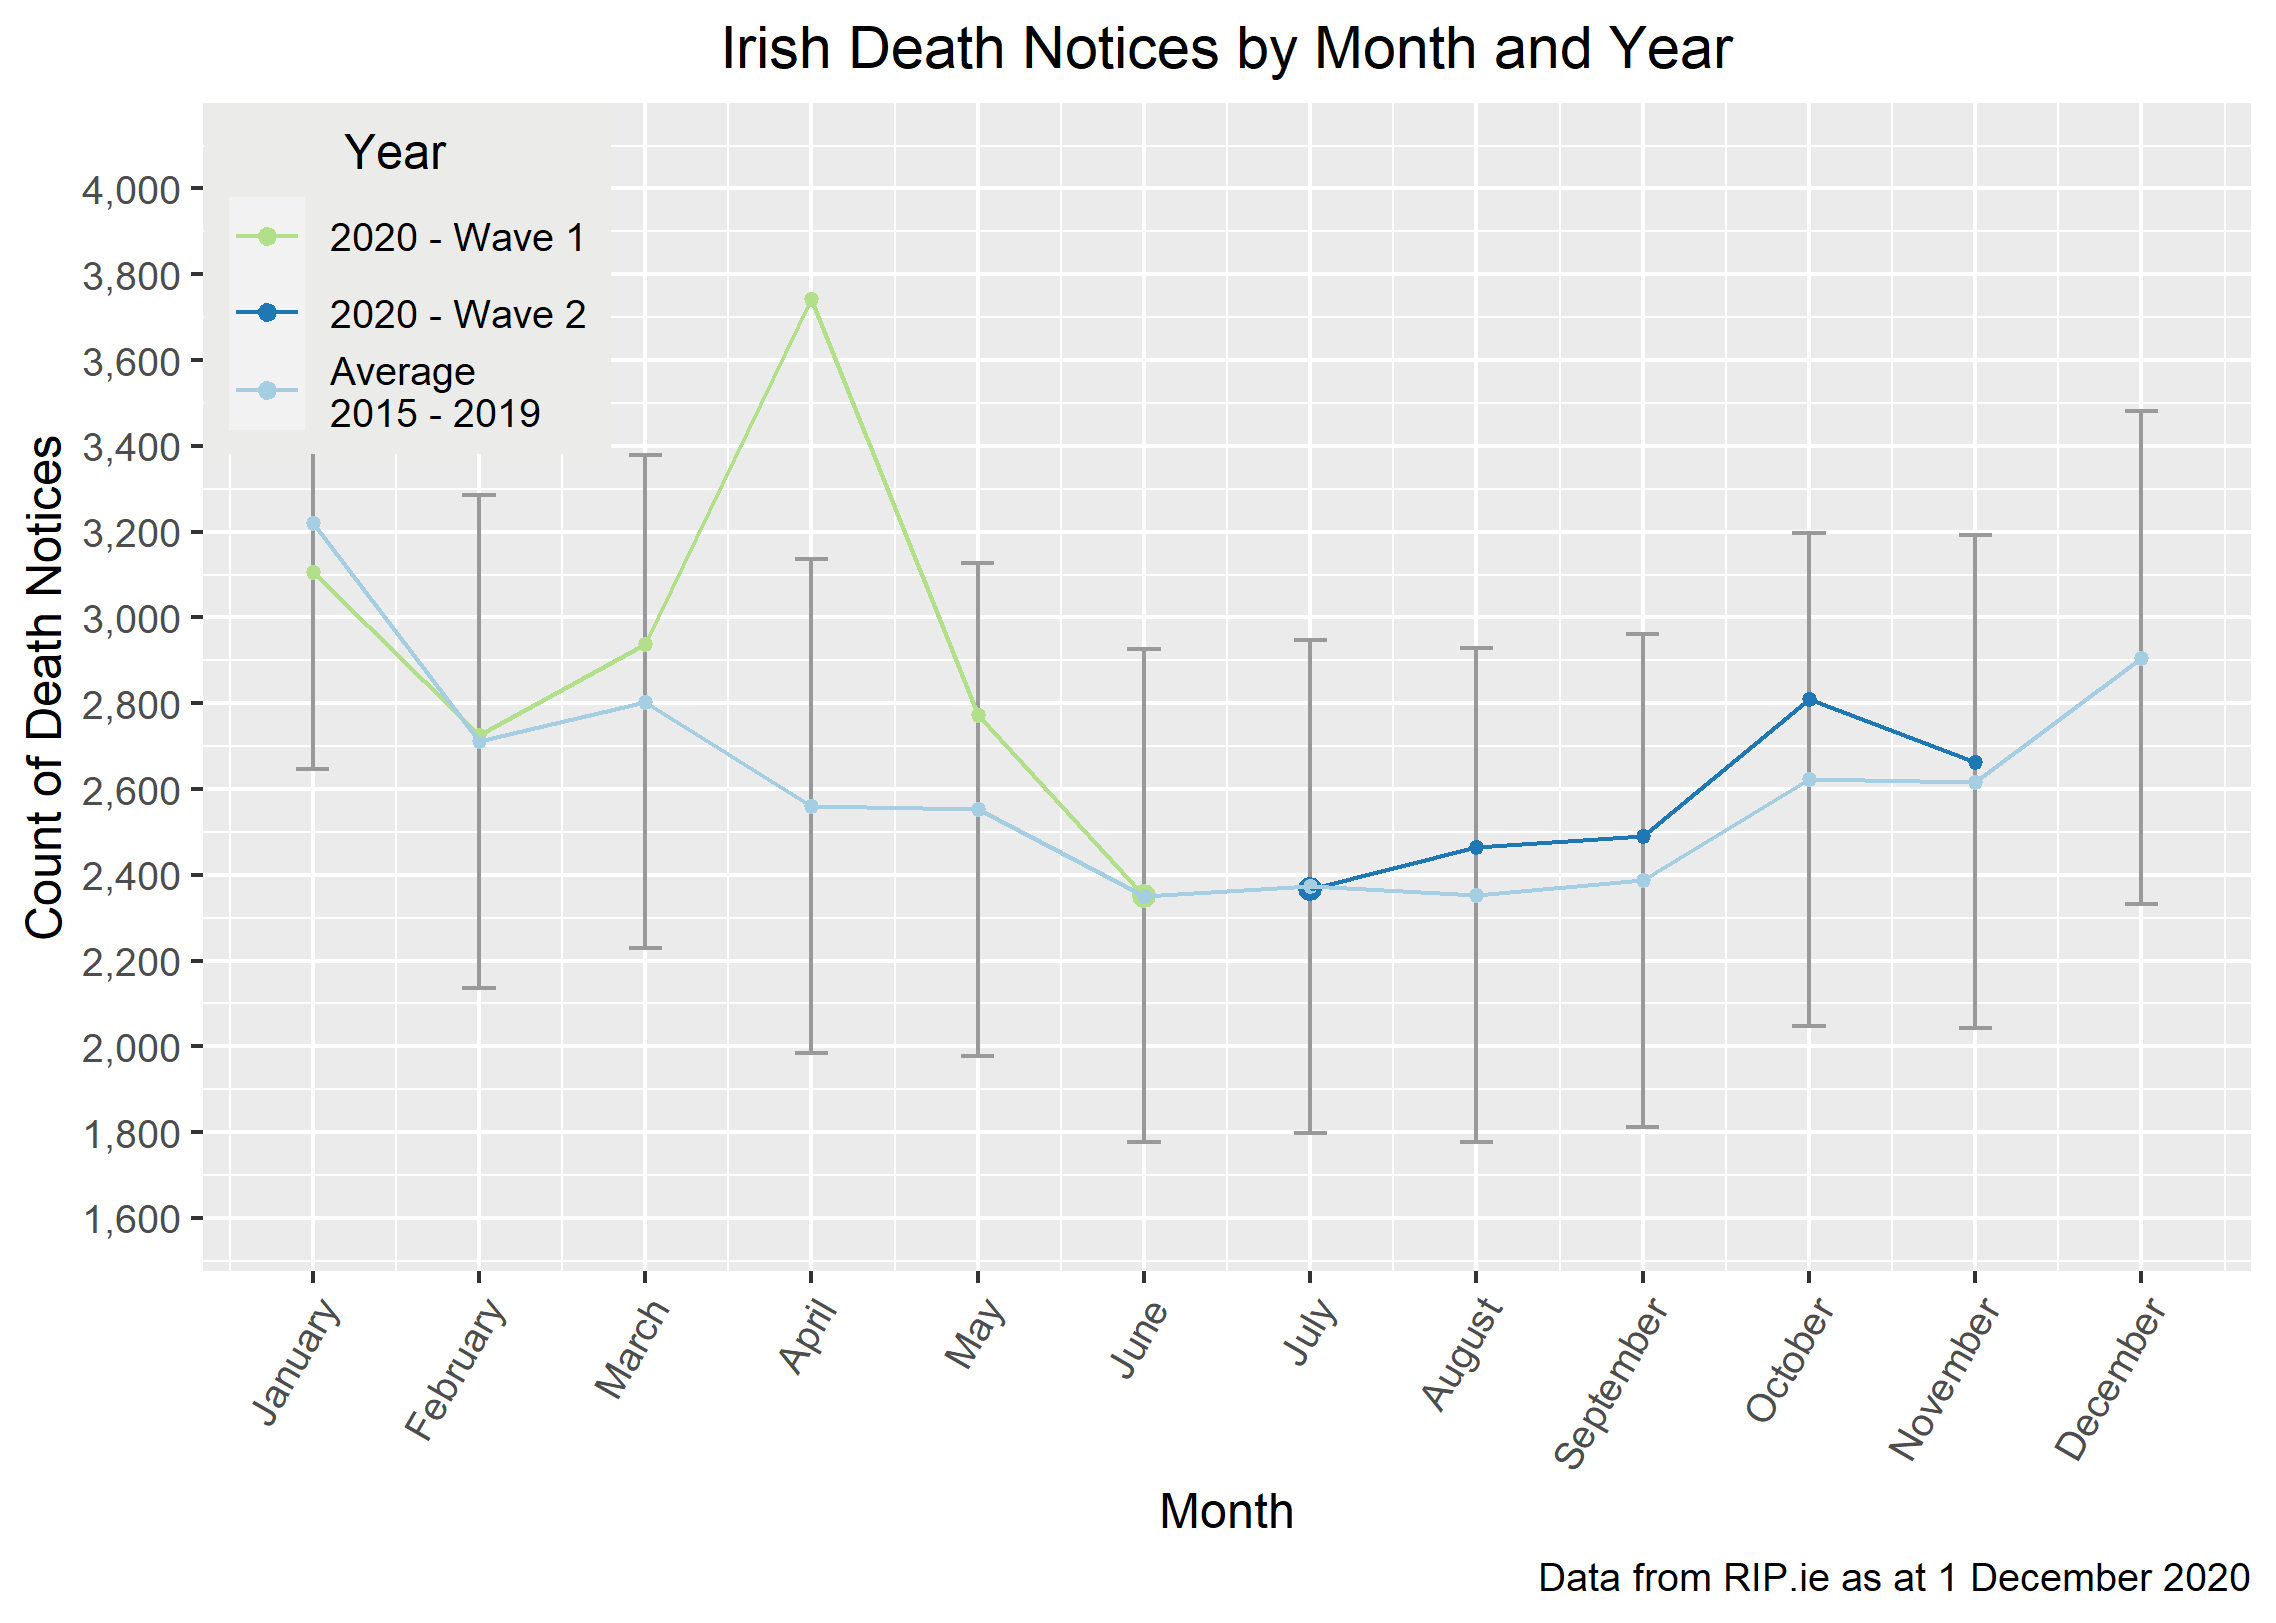
The August experience was a little above average (c.100 deaths over the 2015-2019 average) and this margin remained for September before doubling in October and then falling to c.50 deaths above the 2015-2019 average for November.
This variation is comfortably inside the confidence intervals for this analysis and could simply be normal annual variation. However, the pattern fits with what we know was happening at the time:
- in response to increasing levels of COVID-19 deaths, the Government introduced a second lockdown in mid-October.
- The incubation period between infection and developing symptoms means that there is a lag between any such lockdown measures and any subsequent impact on the number of confirmed infections, often cited as two weeks.
This is consistent with the observed increase in the number of deaths in October and the subsequent fall in November as the impact of lockdown measures were felt.
It is interesting to note that the number of COVID-19 deaths reported by the HSE in August, September and October (which includes deaths with both confirmed and suspected COVID-19 infection) was lower than the number of excess deaths indicated by our analysis. However, the number reported for November and the overall year-to-date count of COVID-19 deaths is higher than the excess deaths indicated by our analysis. The HSE reported death count has been consistently higher than the excess deaths count in months where Ireland has been under lockdown. From this we can infer that deaths from causes other than COVID-19 may fall during a lockdown (e.g. fewer occupational causes) and/or it may be that the propensity of people to get tested is higher during a lockdown and therefore we may observe a higher death rate amongst the population diagnosed with COVID-19 (regardless of the cause of death).
As the graph above clearly shows, the number of deaths typically increases in December and January – this is due to the impact of winter and seasonal influenza, particularly on more vulnerable members of the population. There is anecdotal evidence to suggest this effect may not be as pronounced this winter due to the combined impact of earlier deaths amongst this population and greater societal awareness/support of vulnerable people, as well as the impact of public health advice throughout 2020. Nonetheless, we expect to see an increase in the number of COVID-19 infections in December due to the easing of public health restrictions and the increased socialising involved in the festive period, which in turn is likely to lead to an increase in the number of excess deaths observed in January.
Analysis by gender
The chart below shows the percent of death notices that were male in each month of 2020 against the averages from 2015 – 2019 and confidence intervals.
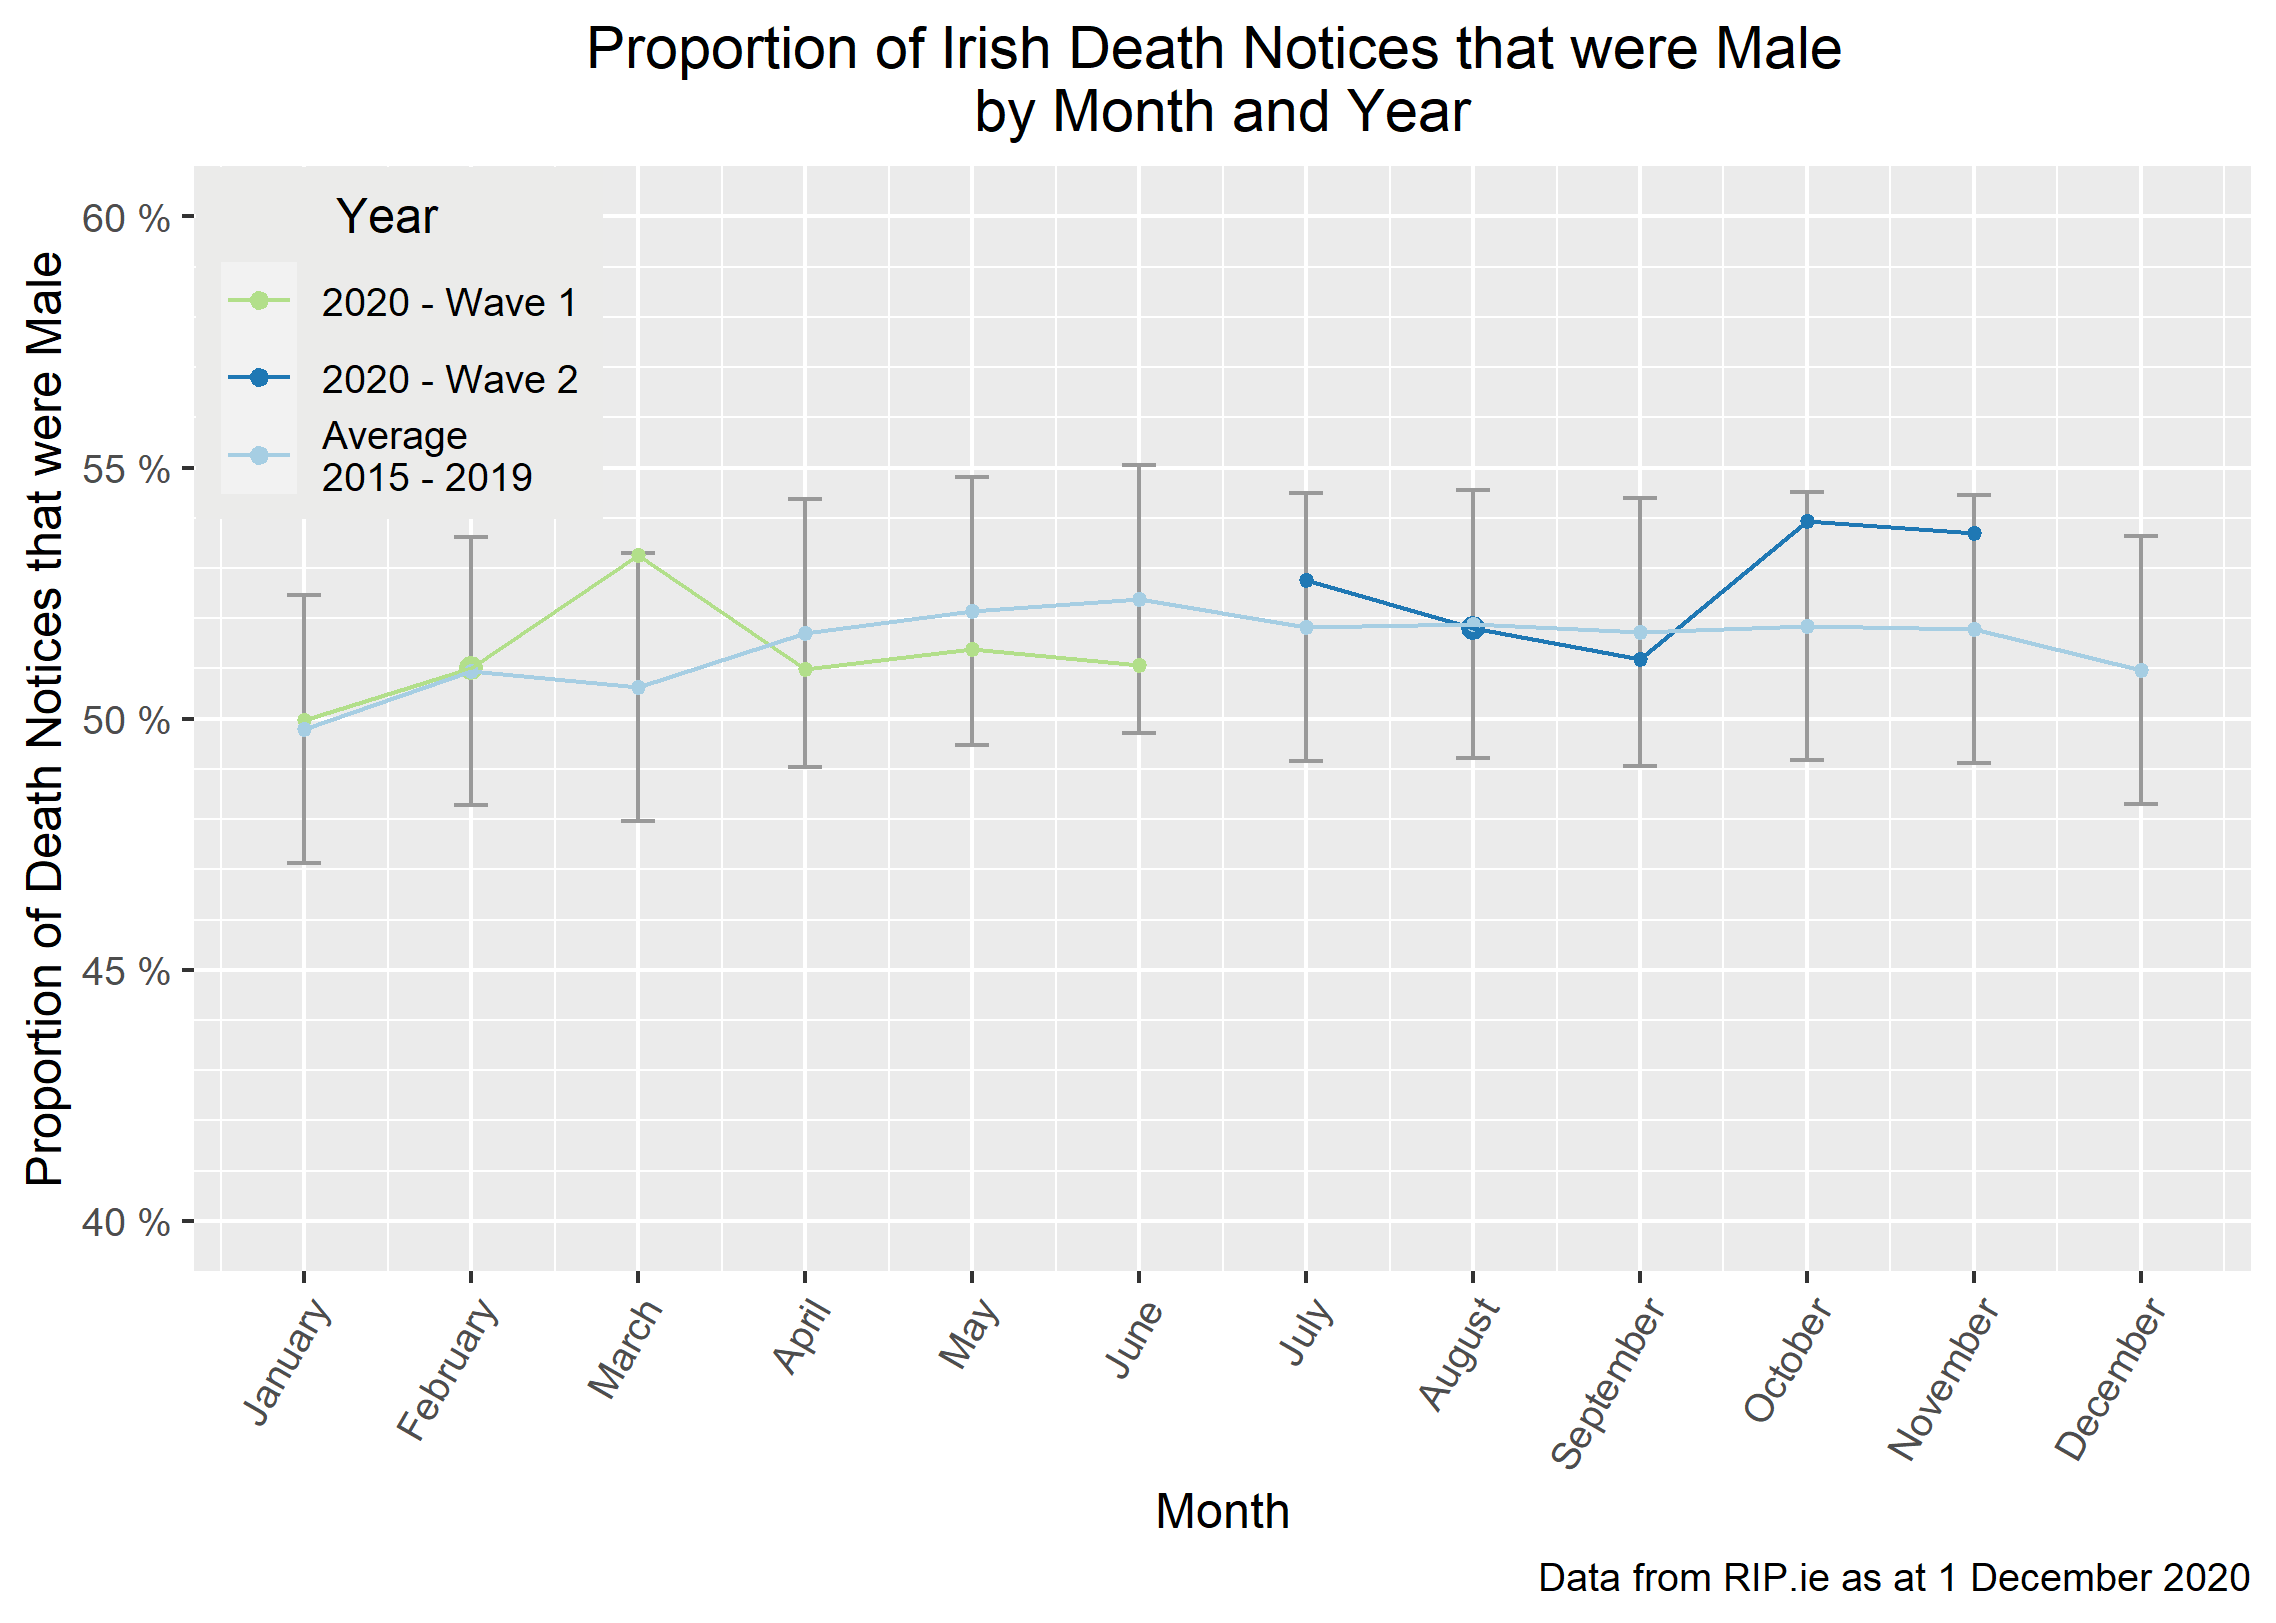
In previous posts we have considered whether there is a relationship between lockdown measures and the proportion of deaths which are male. For example, gender differences in occupation, domestic roles, attitudes or underlying conditions may influence experience. We concluded in our last post that the hypothesis was not supported by the August or September data in which the proportion of deaths which are male had fallen to or below the average level. However, the updated analysis shows that the second wave appears to have a male bias (c.53% of second wave deaths are male). It is not possible to confirm the driver of this from the data but it is worth noting as an example that, unlike the first lockdown, the October lockdown did not shut down traditionally male-dominated industries such as construction.
Considering the overall experience of 2020 to date, the proportion of reported deaths that were male has increased to c.52% while the 5 year average over the same period of the year is c.51%. The difference remains within the range for normal variation but this is first time we have observed a divergence in the year-to-date proportion versus the 5 year average.
County-level gender analysis
We split the above analysis down further to county level and looked at both excess mortality and the proportion of reported deaths which were male. The map below shows the movement in the proportion of reported deaths which were male. The table shows the 2020 excess mortality for each county. Both have been updated with October and November data.
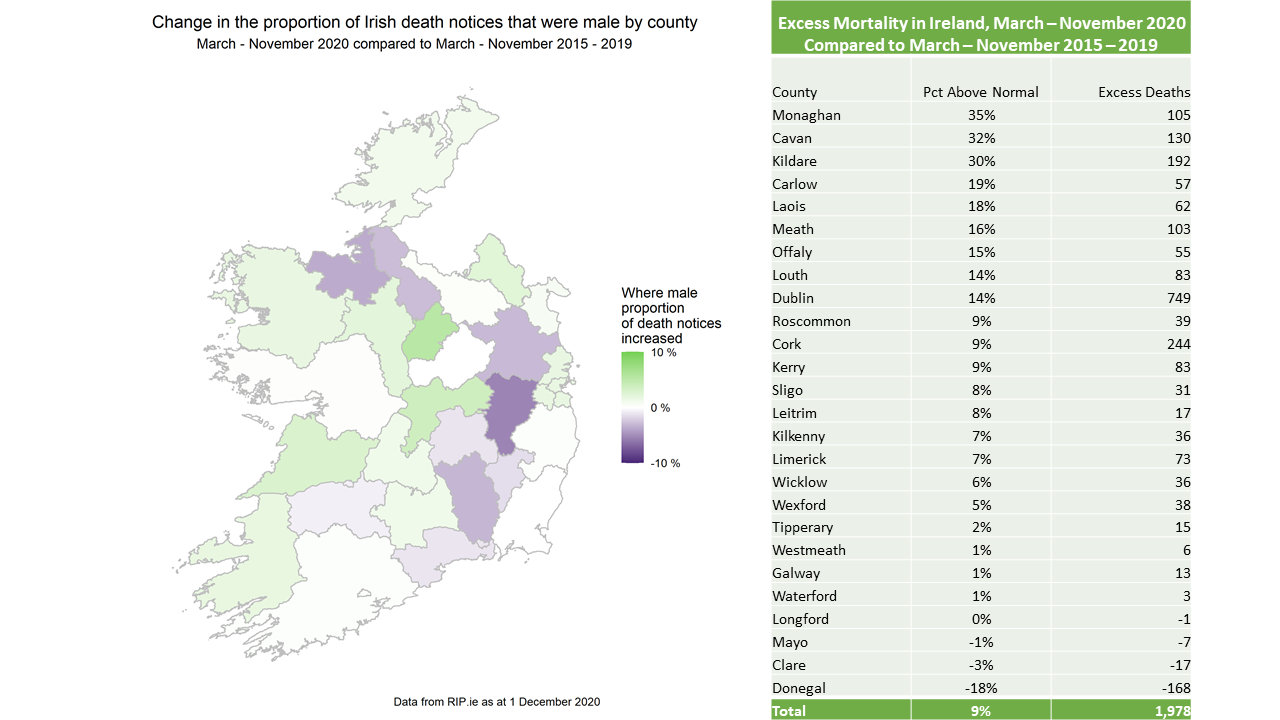
The observations drawn from these visualisations are similar to previous posts with counties at the top and bottom of the list remaining much the same. The biggest mover is Roscommon which has seen an increase in excess deaths from 2% to 9%.
As we move into the winter months when higher number of deaths are expected, we once again see a reduction in the year-to-date excess mortality percentage a number of counties, particularly those at the top and bottom of the list. Countries in the middle have seen small increases in the year-to-date excess mortality percentage (other than Roscommon a noted above).
COVID-19 Public Interest Group
The views of this article do not necessarily reflect the views of the Society of Actuaries in Ireland.