On 3 September, we hosted a panel discussion on excess mortality including Jon Flanagan from the CSO, Dr Gerard McCarthy from Maynooth University, Andrew Smith from University College Dublin and John Nolan from the Society’s COVID-19 excess mortality group. The event was a great success with excellent presentations all round and an engaging discussion between panel and participants. The session was recorded and can be found on actuview.
The excess mortality session touched on the impact of August data on our ongoing analysis. In this post we will present the full refresh of our previous analysis to include August and September data from RIP.ie. All data processing and analysis has been undertaken in line with the approach outlined in our earlier blogs.
In our previous post we noted that the latter part of July had seen an increase in the number of confirmed cases. It is therefore sad but not surprising that August saw an increase in the number of recorded deaths but this has continued into September, potentially indicating that Ireland has already entered into a second wave of the pandemic. The situation continues to change rapidly as people respond both to the headline deaths and the Government’s decisions to further open the economy or introduce national or localised restrictions. The upward trajectory observed in the past couple of months, combined with the rapid approach of the traditional flu season, suggests that a second wave of COVID-19 is likely but, so far, the data is not indicating that this wave will be as significant as the first in terms of the number of deaths or the proportion of excess deaths.
Analysis of deaths in Ireland
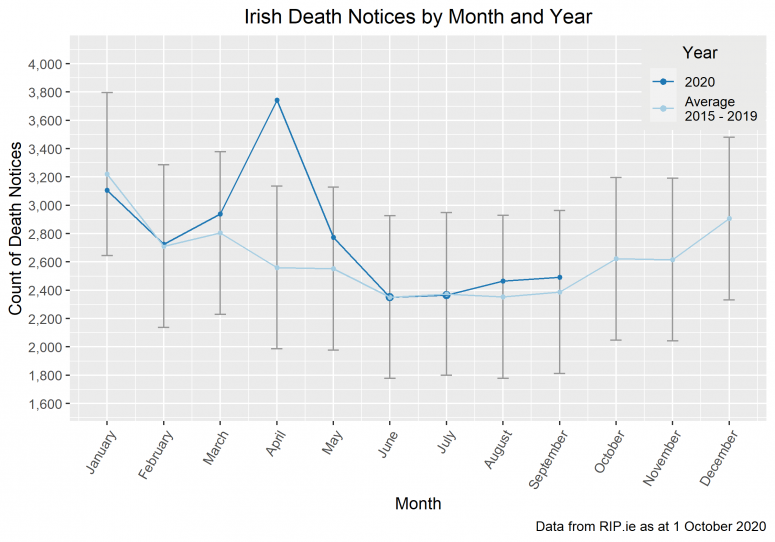
The chart below shows the number of deaths reported through RIP.ie in each month of 2020 against the average number reported for the same month over 2015 – 2019. Confidence intervals of two standard deviations are included in the grey bars for perspective.
Following two months of average deaths, August and September both showed increase in absolute terms and relative to the average (i.e. excess deaths). The level of excess deaths remains well below the level seen in March – May and is comfortably within the range of normal annual variation. Nonetheless, this is the first uptick since the peak in April and may be indicative of things to come.
It is interesting to note that the number of COVID-19 deaths reported by the HSE in August and September (which includes deaths with both confirmed and suspected COVID-19 infection) was lower than the number of excess deaths indicated by our analysis. Therefore, we infer that the increase in both absolute deaths and excess deaths shown in the graph above must include an increase in deaths from non-COVID-19 causes or deaths amongst the untested or asymptomatic population (i.e. deaths of people with COVID-19 but are undiagnosed). It remains to be seen how recent restrictions and local lockdowns will impact the numbers but the data so far suggests that October will see a further increase in the level of excess deaths.
As we are all aware from the HSE statistics, the threat of a second wave of the virus is significant and increasing. The number of confirmed COVID cases reported by the HSE has continued to trend upwards into October and has done so at a faster pace than seen in August and September. So far there has been a relatively small increase in the number of COVID-related deaths reported by the HSE, but we are seeing somewhat larger increase in excess mortality in August and September compared to the immediately preceding months, and we can expect to see this trend continuing. Nonetheless, it is too early to tell how long this will continue for, particularly as Governments both in Ireland and abroad are retaining or reintroducing restrictions aims at controlling infections.
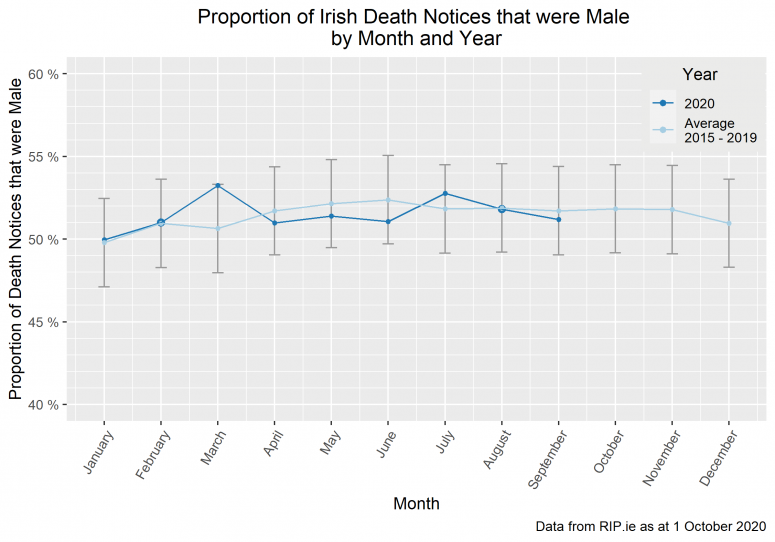
The chart below shows the percent of death notices that were male in each month of 2020 against the averages from 2015 – 2019 and confidence intervals.
In our last blog post we considered whether the fact that increases in the male proportion coincide with the ramping up and down of lockdown measures, might indicate something more than normal variation. For example, gender differences in occupation, domestic roles, attitudes or underlying conditions may have influenced experience. However, that theory is not supported by the August or September data in which the proportion of deaths which are male has fallen to at or below the average level.
Considering the overall experience of 2020 to date, the proportion of reported deaths that were male remains c.51% and the 5 average for the same period of the year is c.51% so the overall split is consistent with the 5 year average.
County-level gender analysis
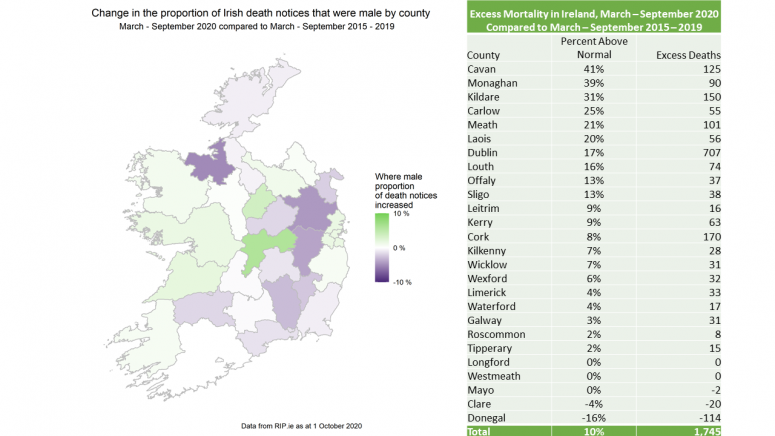
We split the above analysis down further to county level and looked at both excess mortality and the proportion of reported deaths which were male. The map below shows the movement in the proportion of reported deaths which were male. The table shows the 2020 excess mortality for each county. Both have been updated with August and September data.
The observations drawn from these visualisations are much the same as in our previous post. With reported deaths in August/September being just above the 5 year average, we once again see a reduction in the year-to-date excess mortality percentage for the majority of counties, particularly those worst-hit overall. However, the recent upward trend has resulted in a year-to-date increase in excess mortality for a number of counties, particularly Sligo, Leitrim, Kerry, Wexford, Limerick, Waterford, Clare and Donegal. Overall, the 7 worst-hit counties and the 4 least-hit counties, remain the same but the relative position of the other counties has changed significantly due to the increases in some of those counties.
Overall, the August/September update to the analysis above continues to show no clear gender bias in the 2020 death rates in Ireland over the “normal” level of bias contained in the 5 year average for the same period.
COVID-19 Public Interest Group
The views of this article do not necessarily reflect the views of the Society of Actuaries in Ireland.


