Excess mortality blog post #3
Life in Ireland has changed rapidly throughout 2020 as COVID-19 has spread throughout our island. The pace of change makes it essential that we keep reviewing our analysis of the situation. The conclusion that we drew a few weeks ago may not be the conclusion we would reach today.
In this post we refresh our previous analysis to include June data from RIP.ie. All data processing and analysis has been undertaken in line with the approach outlined in our earlier blogs.
Analysis of deaths in Ireland
The chart below shows the number of deaths reported through RIP.ie in each month of 2020 against the average number reported for the same month over 2015 – 2019. Confidence intervals of two standard deviations are included in the grey bars for perspective.
Following 3 months of higher than average deaths, the reported deaths in June are back in line with the average. One month is not enough to conclude that things are back to normal, particularly as we move out of lockdown and, with no vaccine, a second wave cannot be ruled out. Nonetheless, experience to date suggests that we are through the first wave and death rates may be returning to normal, even though daily life in Ireland is still far from normal.
The overall picture throughout 2020 is not as stark as we might have thought going into the crisis. March, April and May saw higher than expected numbers of deaths. While it is only in April that we see deaths varying from the average by more than might be explained by normal annual fluctuation, the sustained period of above average deaths indicates a period of excess mortality due to COVID-19.
Analysis by gender[1]
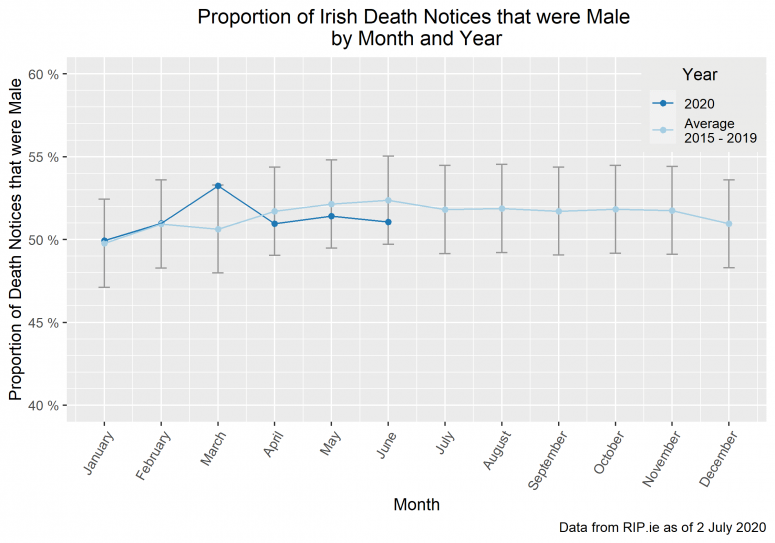
The chart below shows the percent of death notices that were male in each month of 2020 against the averages from 2015 – 2019 and confidence intervals.
With the updated June data, we see that the 2020 pattern is deviating from the average. As the pandemic was reaching Ireland, March had disproportionately more male deaths reported, so much so that it was on the edge of the confidence interval. The subsequent experience suggests that there is no male bias in excess deaths over 2020. March may have been a normal annual fluctuation which would have happened regardless of COVID-19, it may reflect a more rapid infection and death rate amongst males with underlying conditions or, it may reflect the fact that lockdown measures were not in place for much of March. Differences in occupation, attitude or underlying conditions may have resulted in a higher proportion of male deaths before lockdown.
From April onwards, the split of male and female deaths has been 0.5% - 1.0% below the historic average. The variation in any given month is within the expected range (i.e. with the confidence intervals) but the consistent pattern month-on-month makes this more significant. This pattern may indicate a female-bias in COVID-19 death rate or it may indicate that the male-bias in the “normal” death rate is not present in the COVID-19 death rate. If the death rate is the same for both males and females then the greater proportion of females in the population at higher ages results in a greater number of female deaths.
Whether COVID-19 death rates have a female bias or whether the death rate is neutral but the at-risk population[2] has a female bias, the result is the same – women account for more COVID-19 deaths than men. Similar conclusions have been reached by other researchers, particularly the recent analysis by the Central Statistics Office and the Oireachtas Covid-19 Committee presented in The Journal.
Alternatively, it could simply reflect an offset in the timing of the deaths with the overall male-female proportion remaining in line with the average. That is, males were impacted more quickly by COVID-19 leading to the higher proportion of male deaths in March. The lower proportion of male deaths in the subsequent months reflects the natural correction of this as there are fewer at-risk males in the population so females accounted for a higher proportion of deaths during these months. Considering 2020 as a whole, the proportion of reported deaths that were male is c.51% and the average for the first 6 months of the year is c.51% so the overall split is consistent with the average.
County-level gender analysis
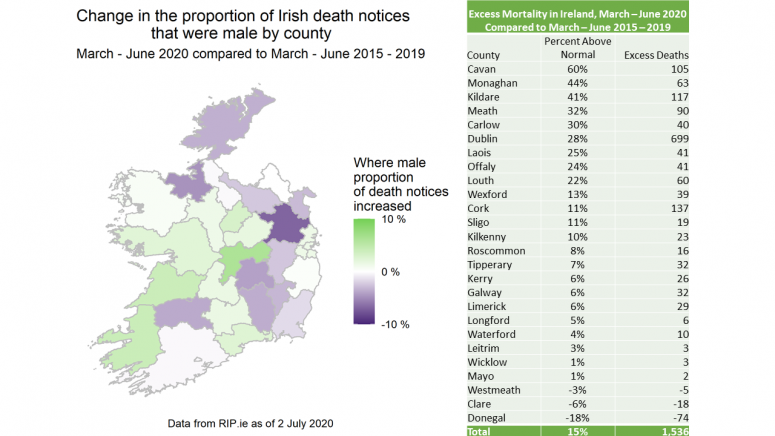
We split the above analysis down further to county level and looked at both excess mortality and the proportion of reported deaths which were male. The map below shows the movement in the proportion of reported deaths which were male. The table shows the 2020 excess mortality for each county. Both have been updated with June data.
The observations drawn from these visualisations are much the same as last month. It is clear from the above that, at a county level, there have been pockets of significant excess mortality over March – June 2020 with mortality more than 40% above normal in Cavan, Monaghan and Kildare. There are a number of counties where mortality is close to or below average levels, with Donegal experiencing mortality 18% below average for the period. There have also been pockets of both increased and decreased male-bias in the reported deaths. Total excess mortality is down to 15% for March – June from 19% for March – May further illustrating the improvement in June.
The June update to the analysis above shows clearer evidence that there is no male bias in COVID-19 death rates in Ireland. It also shows some evidence of a female bias in COVID-19 deaths in recent months but the overall split of male and female deaths in 2020 is in line with the average so it is too early to conclude that there is a definite bias.
[1] In this and all other posts in this series, analysis has been sub-divided into genders of male and female to facilitate comparative analysis. In carrying out the analysis for these two groups only, we do not imply that these are the only genders possible but we were unable to identify other genders in the data used.
[2] The term “at-risk population” is used throughout this blog with the plain English meaning used in the media, i.e. the people that are most at-risk – the elderly and those with underlying conditions.
COVID-19 Public Interest Group
The views of this article do not necessarily reflect the views of the Society of Actuaries in Ireland.


