The final phasing out of restrictions in Ireland lasted a month before the number of deaths increased significantly, the Omicron variant hit our shores and restrictions were reintroduced. As we move into the holiday period and the normal winter viruses circulate alongside the COVID-19 variants, the return to “normal” looks further in the future than the country, or the world had been hoping.
The speed at which the Omicron variant moved across the globe is a sign to us all that we as a country need to be thinking globally in our response to the immediate COVID-19 challenges. As actuaries, we also need to take a global view in looking at how our experience might change in the future or what risk factors we need to consider.
In this post we present the results of our most recent analysis of experience in Ireland. Our updated results are based on data from RIP.ie to 1 December 2021 and all data processing and analysis has been undertaken in line with the approach outlined in our earlier blogs.
Analysis of deaths in Ireland
The chart below shows the number of deaths reported through RIP.ie in each month of 2020 (dark blue) and 2021 (green) against the average number reported for the same month over 2015 – 2019 (light blue). Confidence intervals of two standard deviations are included in the grey bars for perspective.

October experience showed that we were premature in our previous post where we had seen September potentially marking the start of a period of the heavier than normal winter. By October, we saw the month-on-month increase in the number of deaths begin less than the trend in the average. The number of deaths in the month was still noticeably above the average but no new indications of a winter surge in deaths.
The positivity was short-lived, Ireland removed or reduced the majority of the remaining restrictions on 22 October. Amongst other things, this meant that nightclubs reopened, limits on wedding guest attendance were lifted and more than 6 people were allowed to drink or dine together. Naturally this resulted in increased socialising at a time when winter weather is driving people indoors. This combined with a potentially waning vaccine immunity amongst those that received their vaccines first (i.e. the most vulnerable), may have created a perfect environment for a new wave of the virus. November has seen a spike with deaths in the month moving outside our confidence interval range for the first time since February, and only the fourth time since the COVID outbreak began.
Whether the Omicron variant was already present but undetected in November cannot be known but the first confirmed case was in December and early indications are that the vaccines are less effective against this variant (except potentially for triple-dosed people[1]). December and January were typically the annual peak in terms of number of deaths even before COVID-19 so recent experience and early indicators from the Omicron variant suggest that despite the reintroduction of restrictions, it is likely that December will see a high number of deaths.
Analysis by gender
The chart below shows the percentage of death notices that were male in each month of 2020 (dark blue) and 2021 (green) against the corresponding averages from 2015 – 2019 (light blue) and confidence intervals.
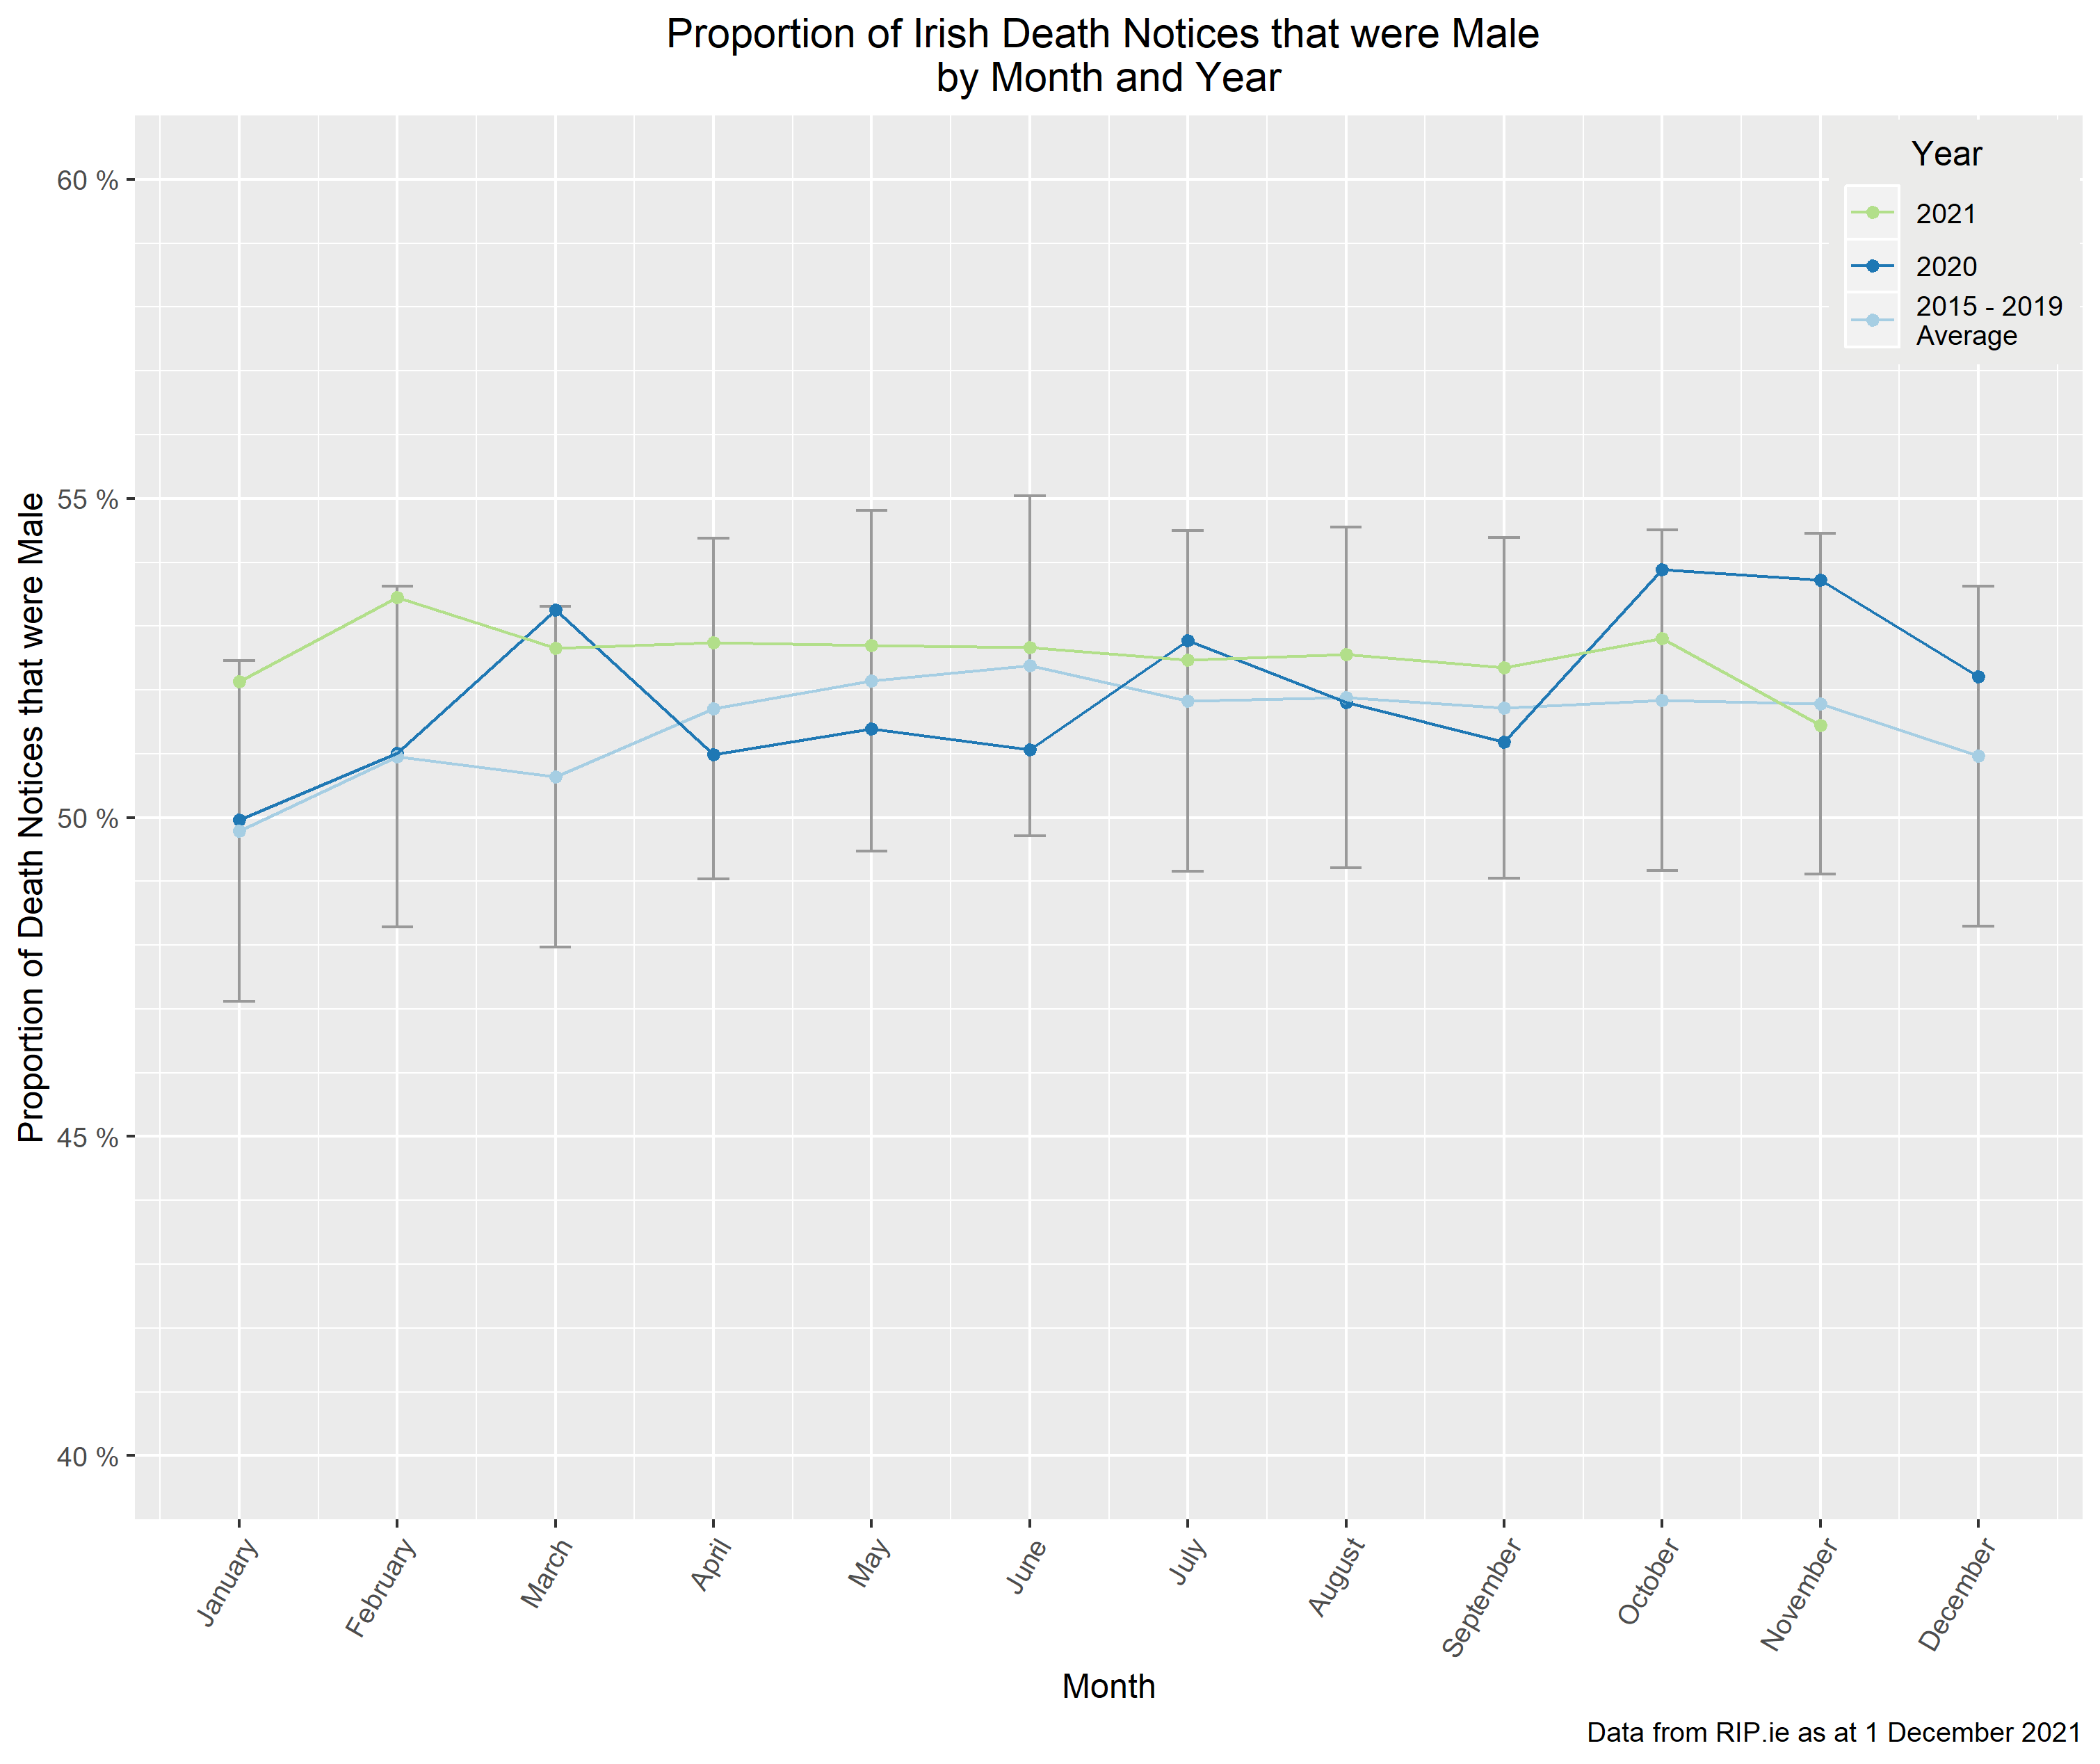
The higher than average proportion of male deaths which we have discussed in previous posts took a significant turn in November, with the male proportion dropping below the average for the first time in more than a year. As the deviation from the average is very small, this change may just support the view considered in our previous post that the gender balance is returning to “normal” levels with the difference being simple annual variation. However, the month-on-month change in the proportion is the largest we have seen in 2021. The number of female deaths has increased more than the number of male deaths both proportionally and in absolute terms, both of which suggests there may be something more driving the change in the gender mix. The data we use for this analysis does not allow us to identify what these drivers but the HPSC has stated that the average age of deaths in November is in the mid-70s[2] and the majority of clusters have been in residential facilities, nursing homes and hospitals[3] which, anecdotally at least, have a higher proportion of females.
County-level gender analysis
The above analysis was further examined at county level, focusing on both excess mortality and the proportion of male reported deaths from the start of the pandemic through to the end of November 2021. The following map shows the movement in the proportion of reported deaths which were male, with the excess mortality for each county in the corresponding table.
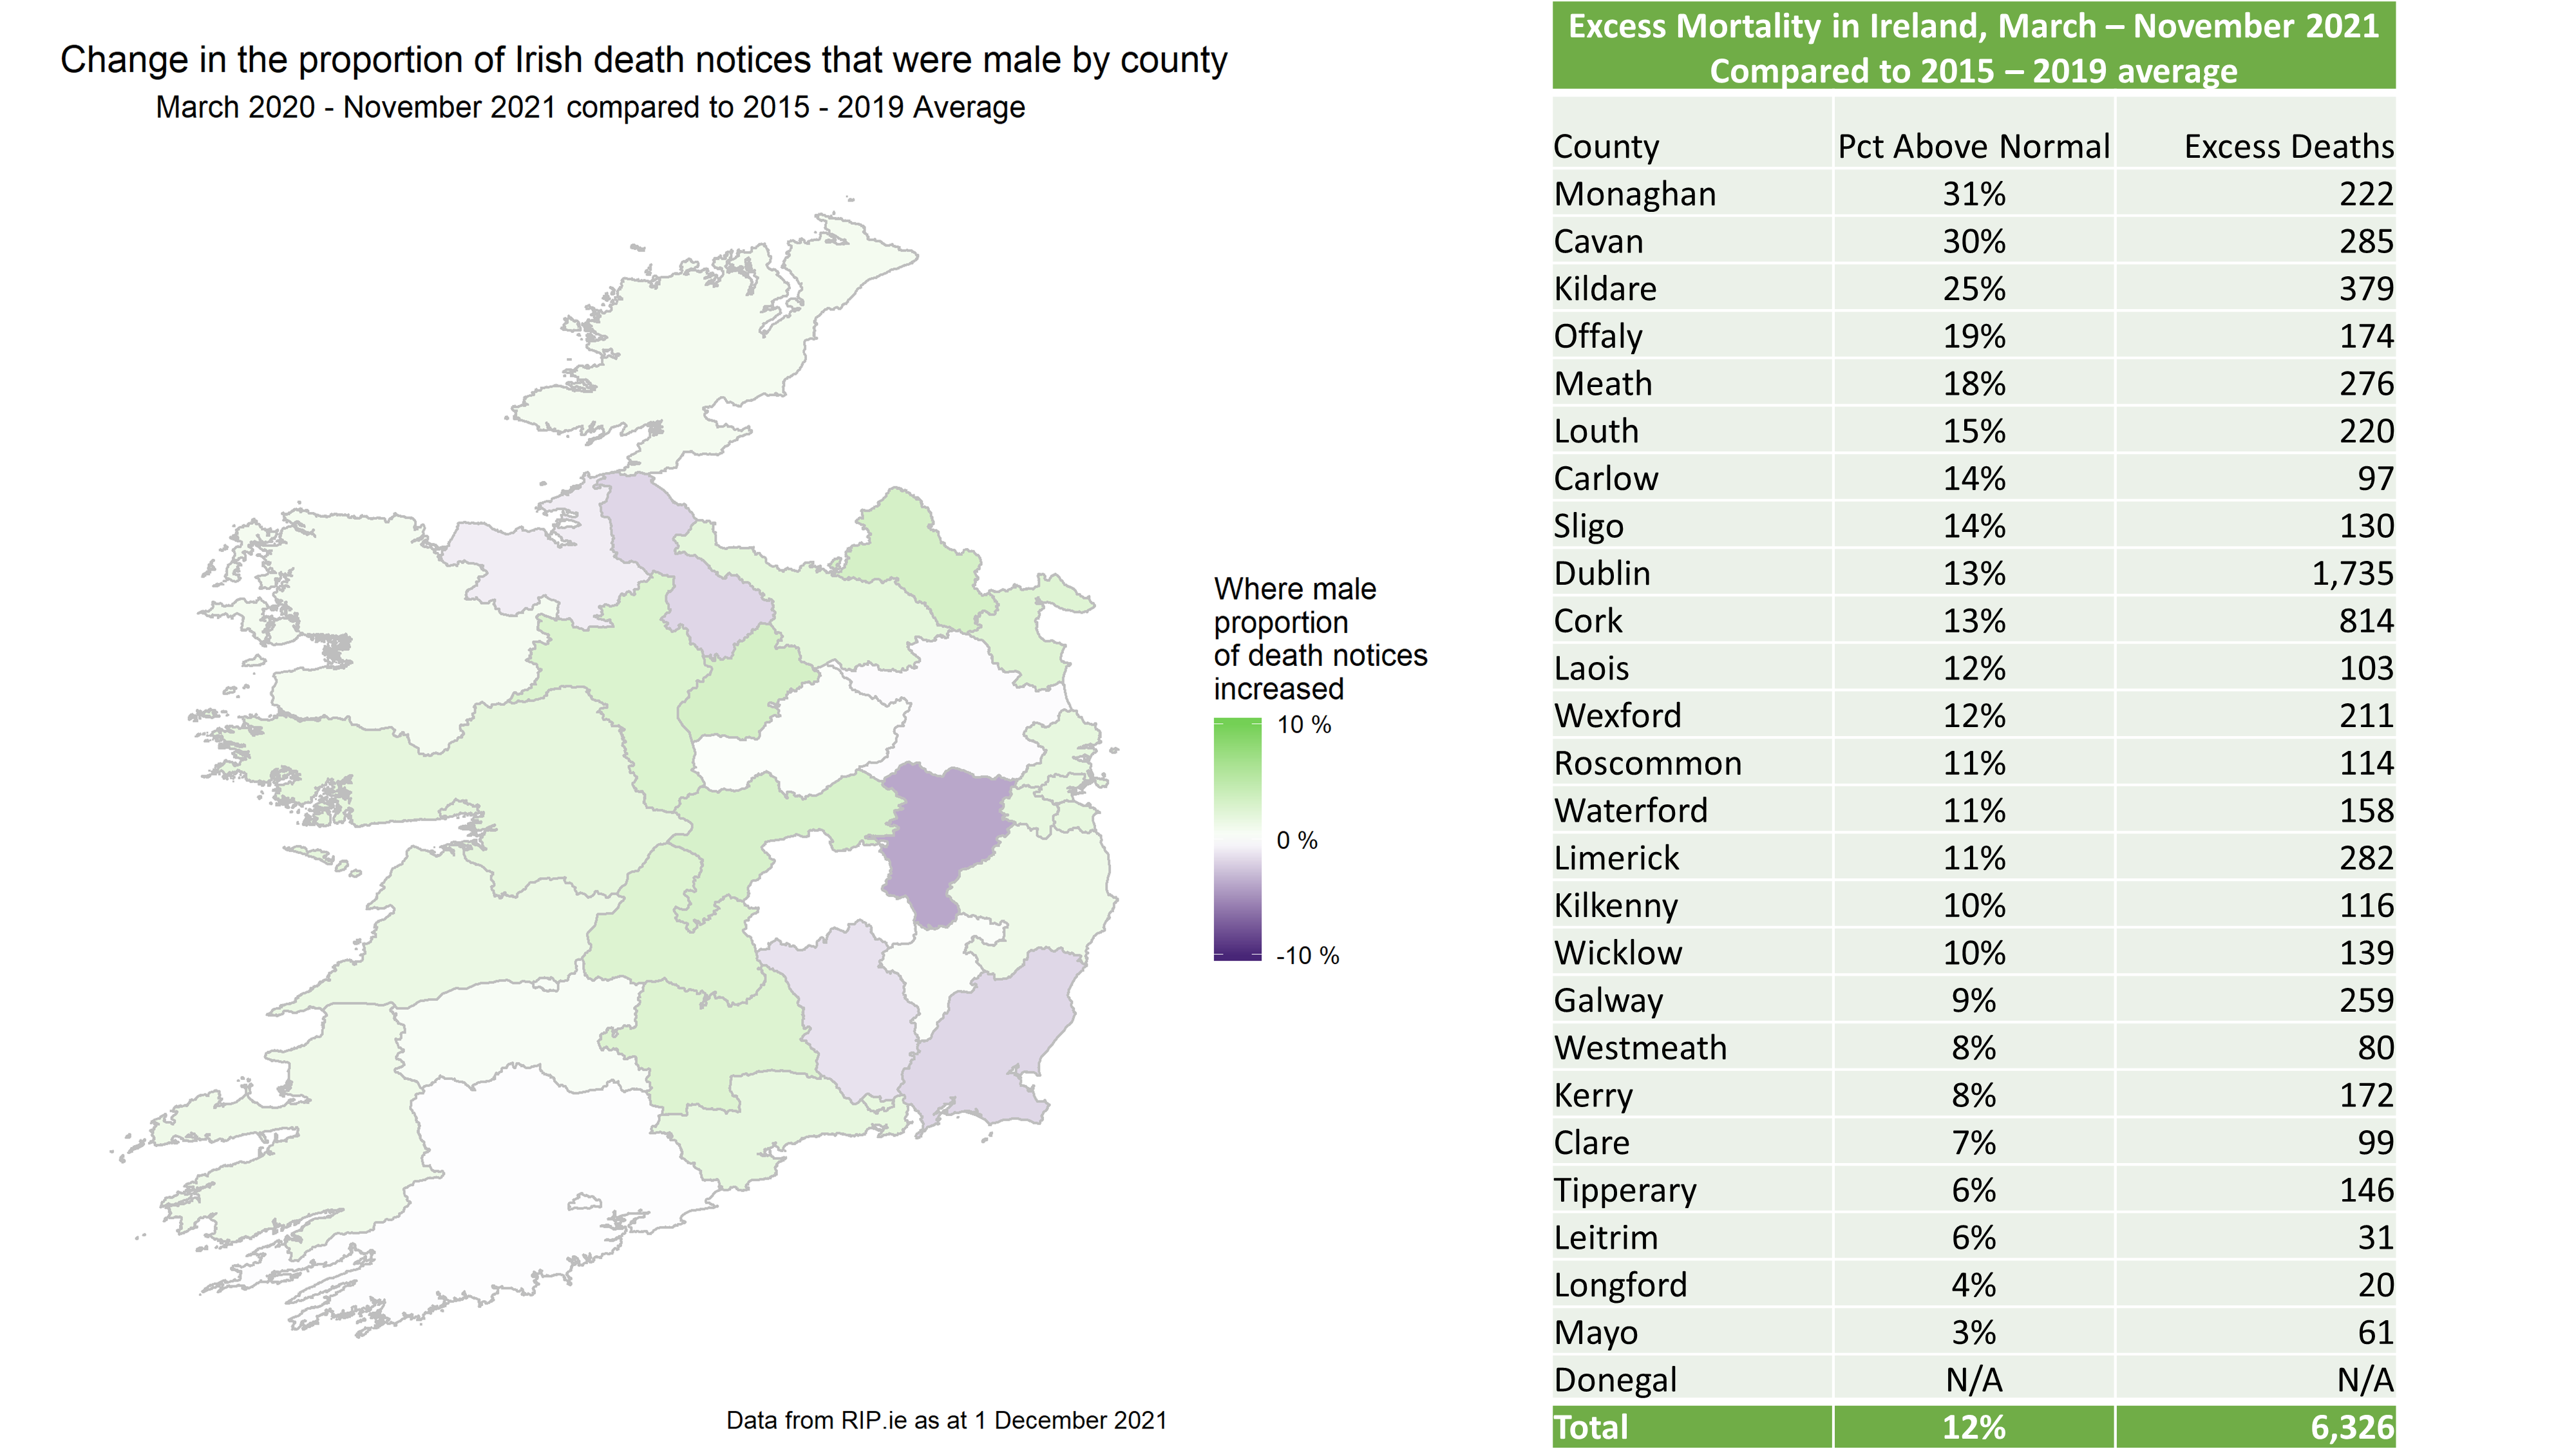
As discussed in previous posts, the experience observed in Donegal appears to be caused by a change in the way RIP.ie is used in the county rather than actual experience and therefore, we have excluded it from the table. Similar features have not been observed in the other counties, so the above breakdown remains our best view of the county-level impact at the current time.
Excess mortality – population adjusted
Consistent with our approach in prior posts, the analysis above has not been adjusted for changes in the population over time. However, using the population-adjustment methodology presented in post 12 and used again in our recent posts, the chart below shows excess mortality measured against the 2015-2019 average and against the population adjusted average.
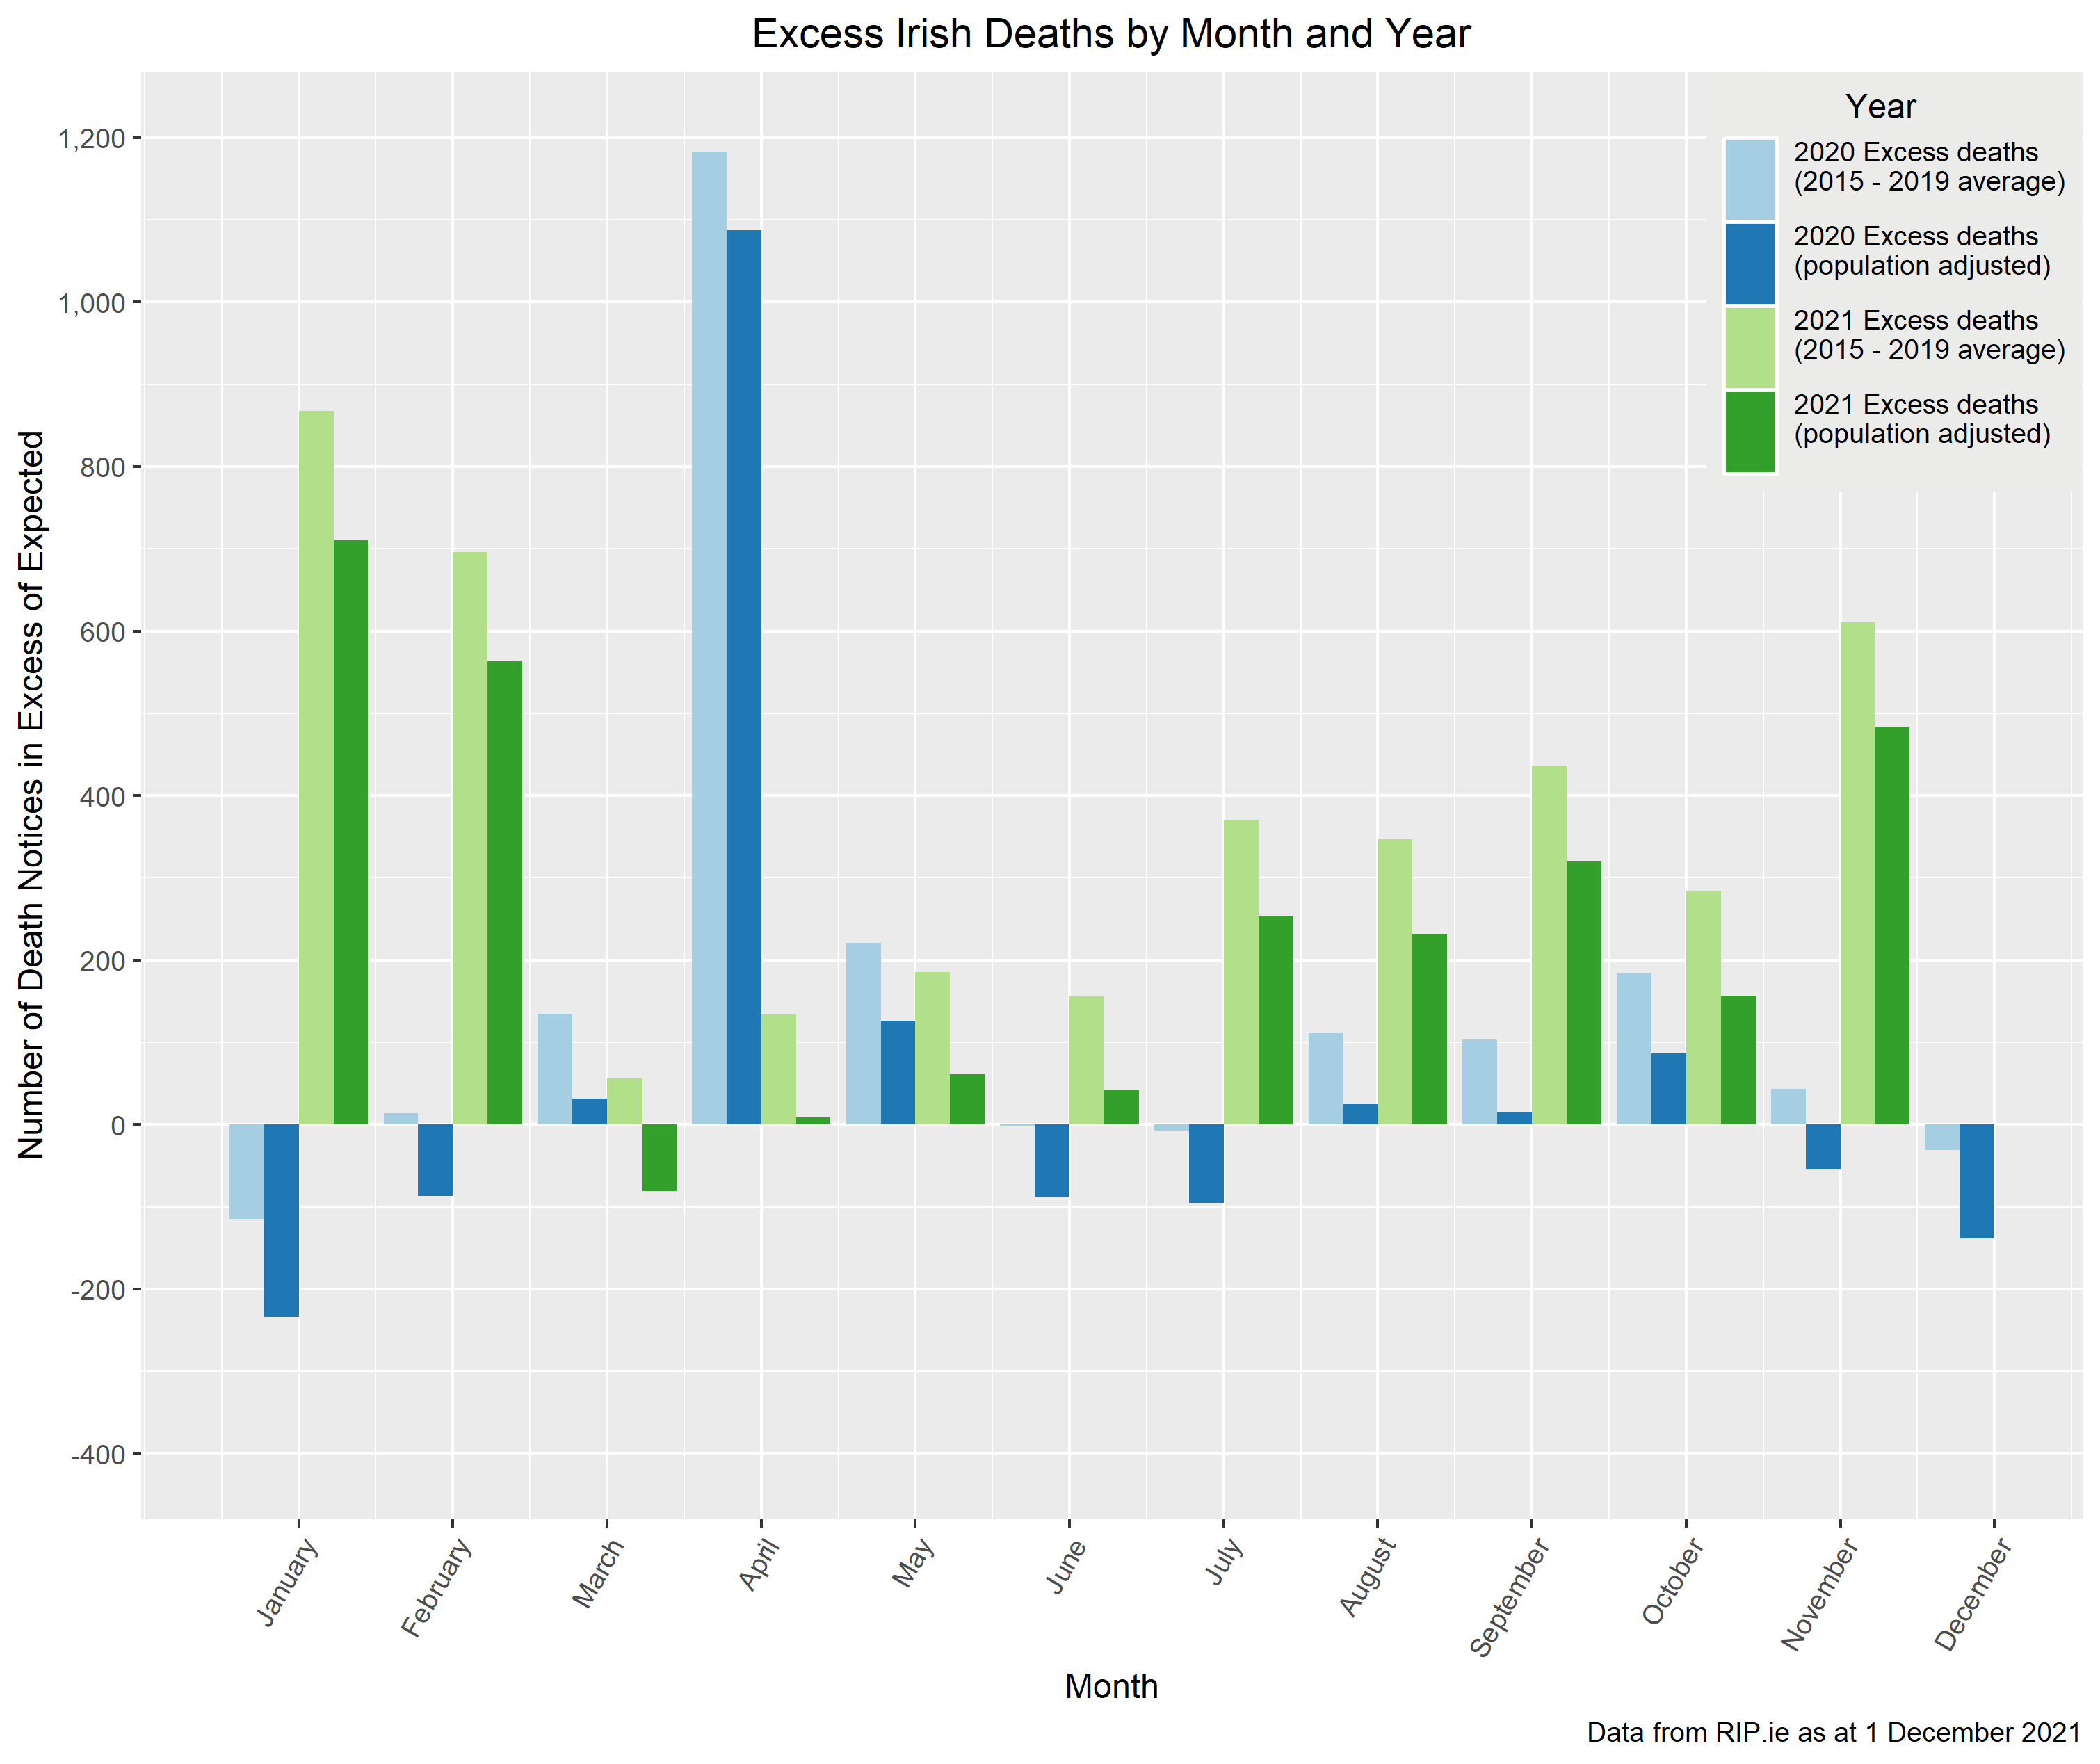
Total excess mortality in 2020 is 1,857 when measured against our standard 5-year average but reduces to 692 when measured against the population adjusted 5-year average. The corresponding total figures for the first 11 months of 2021 are 4,143 and 2,749. However, as discussed in the prior posts regarding this methodology, the lower excess mortality figures implied by the population-adjusted analysis do not allow for the offsetting impact of mortality improvements over the same period, so the true excess mortality may fall between these counts. Furthermore, it is clear from the chart above that regardless of the measurement approach adopted, November 2021 was the highest excess mortality month since the vaccination program began and the fourth highest since the COVID outbreak began. Given the impact the holiday season had on excess mortality last year, this apparent peak is a concern for us as individuals and as actuaries setting prospective assumptions regarding experience in the short-term and what this means for long term assumptions and estimates.
COVID-19 Action Group
The views of this article do not necessarily reflect the views of the Society of Actuaries in Ireland.
[1] https://www.rte.ie/news/world/2021/1208/1265561-pfizer-jab-neutralises-omicron-with-3-shots-study/