Now that we’re into the second year of our battle with COVID-19, we thought it would be interesting to revisit the question of the presence of any gender bias in the deaths caused by the virus in Ireland.
During the first wave of deaths which occurred in March to June last year there were reports from abroad of gender bias which varied in severity but all showed excess mortality to be less in females than males[i]. Our research on Irish deaths was inconclusive in that regard but we noted that there may have been influences which obscured any gender bias effect. In particular, a lack of detail in the data to which we had access as well as the higher than normal level of deaths in sheltered care environments where the population is more predominantly female than in the general population.
In more recent months, our regular analysis has been showing a fairly clear male bias in overall deaths but the data underlying our previous analysis was unable to tell us
- whether men are more likely to die from the virus if they get it (i.e. a bias in the virus itself or male immunity) and/or
- whether men are dying in greater numbers because they are more likely to get it in the first place (i.e. a bias in the cultural/societal/workplace responses to the virus).
A greater volume of data and data granularity is now available from the CSO website[ii]. In particular, weekly data spilt by gender is now available for COVID-19 cases and deaths (rather than the total deaths which we considered in our other posts). The source of these data is the weekly returns sent to the CSO by the Health Protection Surveillance Centre (HSPC) based on data provided to them by the Computerised Infectious Disease Reporting (CIDR) system.
CSO reports are subject to revision due to late notification or reclassification of deaths and cases but those tend to be minor except during periods of high incidences of deaths. The CSO does not show a detailed breakdown of deaths by gender when the numbers are small - typically in small single figures nor do they show the total number of deaths if that figure is also sufficiently small. The data also include case and deaths broken down by age band. There are some discrepancies between the total cases and deaths broken down by gender and the total broken down by age band, but these are not material for the purpose of our analysis.
In this post we have set out our analysis of the gender split of COVID-19 the CSO data implies. We have focused this analysis on the first of the two questions noted above, i.e., whether men are more likely to die from the virus if they get it.
As the analysis presented on our previous posts has indicated potential differences in the gender split bias of Irish experience at different stages of the pandemic, we have considered different phases in the analysis presented in this post. To determine a reasonable number of phases and the lengths of these, we have first considered overall COVID-19 death experience. The charts below shows the weekly number of COVID-19 deaths and cases in Ireland over the period of pandemic.
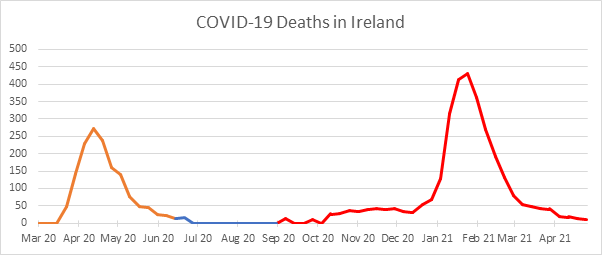
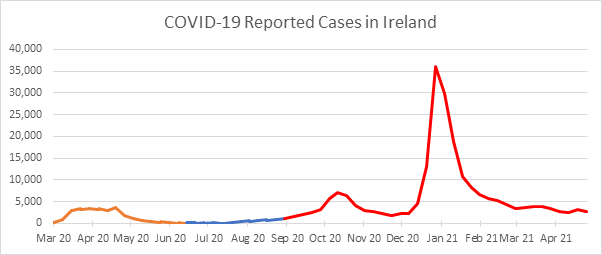
From the chart above, it is clear that the results can be broadly divided into the three phases of the pandemic experienced to date.
- Phase 1. This was the initial phase and is defined (for this purpose) as ending on 19 June 2020.
- Phase 2. This was the secondary phase where deaths and cases were very low in comparison to phases 1 and 3.
- Phase 3. This is the current phase and is coming to an end as the vaccination process largely suppresses the effects of the virus. We have defined it (for this purpose) as commencing on 4 September 2020 and ending on 26 March 2021[iii].
When we look at the gender breakdown of the incidence of deaths and cases in the three phases, an interesting picture emerges.
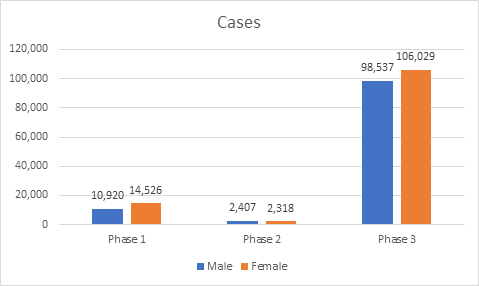
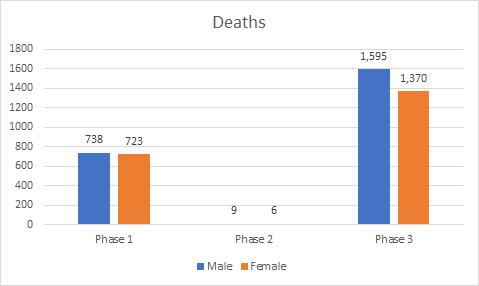
It clearly can be seen that whilst female cases were higher than male, male deaths were noticeably higher than female deaths, particularly in Phase 3. It is known that COVID-19 mortality is higher at older ages, so it could be a case that all the cases are amongst older males and younger females. Unfortunately, whilst the CSO data splits cases and deaths by gender and age band, it does not provide both splits simultaneously.
To overcome this shortcoming in the available data, we apply population gender splits to the age band data. The assumption is that within each age band cases occur amongst males and females in proportion to the population ratio of males to females within that age band. This is not a given – for example, case incidence and/or testing may be more prevalent amongst health care workers or meat factory workers, whose gender breakdown may be different than the general population. If this assumption is correct, then when we apply the split the resultant split by gender should correspond closely to the actual split by gender[iv]. When we do this we see that the evidence suggests this approach is not reliable for Phase 1, but is reasonably reliable for Phases 2 & Phase 3. Intuitively, this feels correct – testing was much less widespread in Phase 1, being focussed on groups (e.g., care home residents) that might not be representative of the population as whole, whereas in Phase 2 & 3 testing was much more widespread and so detected case incidence should correlate more closely to the general population.
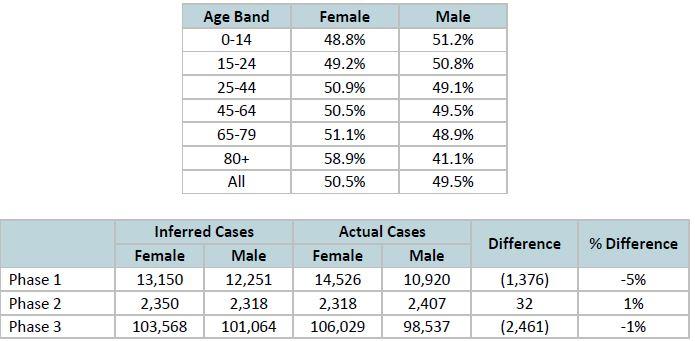
In the general population, the following is the distribution of deaths by gender in the relevant age bands.
This is evident graphically:
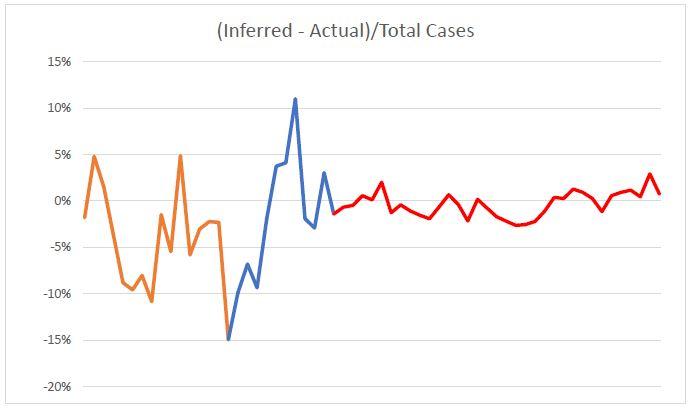
It is evident that the data in Phase 1 are not reliable to apply this approach. Likewise, Phase 2 is too volatile, but this is likely due to the small numbers involved. On the other hand, it appears that this approach is a reasonably reliable assumption when applied to Phase 3. So, we focus our analysis on the Phase 3 data.
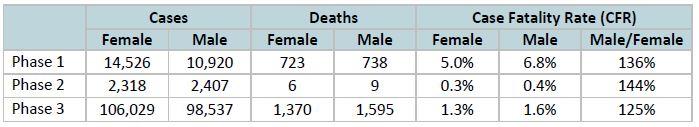
The raw data indicates a higher mortality rate for males. The high case fatality rate in Phase 1 is likely due to the lower levels of testing in the general population.
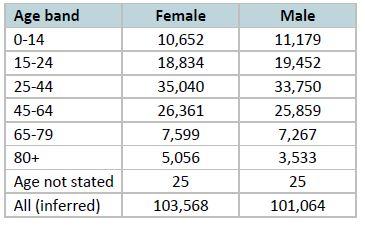
However, we need to adjust the data for the difference in age profile of the sexes. Using our assumption above, that the proportion of cases in each age band for each gender is proportional to the population split by gender for each age band, we infer a number of cases by age band by gender for Phase 3 as follows:
The case fatality rate by age band[v]:
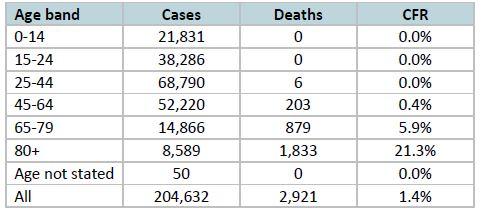
Applying these case fatality rates by age band to the inferred cases by age band by gender we get an expected number of deaths by gender, if the case fatality rate were the same for males and females[vi]:
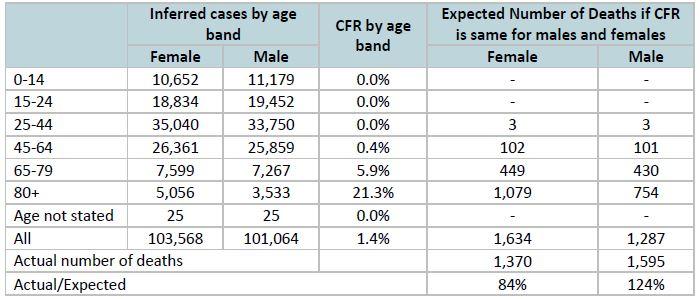
Therefore, after adjusting for the difference in age profile of the cases in Phase 3, it is clear that the Case Fatality Rate is higher for males than females. There may be different reasons for this – higher incidence of co-morbidities (obesity, heart disease, diabetes) amongst males, higher rates of smoking and alcohol intake amongst males, and better immune response systems amongst females. Whilst reasonable, these are conjecture.
Overall, our analysis shows a gender bias of over 20% in favour of females at the highest aggregate level. That bias could, however, be nearly 50% depending on the age profile of cases within reported age bands.
These findings are consistent with experience in most other countries where data is available. Based on the latest data from Global Health 50/50, the median male to female ratio of deaths in confirmed cases across 95 countries that report data recorded separately by gender is 1.35.
[i] For example, see https://www.irishtimes.com/news/ireland/irish-news/coronavirus-why-are-men-twice-as-likely-to-die-as-women-1.4222408
[ii] All data presented in this analysis comes from: https://www.cso.ie/en/releasesandpublications/ep/p-covid19/covid-19info…
[iii] Although data were available up to 30 April, 26 March was chosen as the cut-off as the vaccination roll-out to health care workers and over-80s would distort the analysis as females are over-represented in both these cohorts.
[iv] This is a necessary, but not sufficient, condition for the assumption to be correct. That is, if the distribution of cases within age bands is in proportion to the gender split within that age band the resultant split by gender will correspond closely to the actual split by gender, but this alone would not verify that the distribution of cases within age bands is in proportion to the gender split within that age band.
[v] There are 44 more deaths (1.5%) in the death figures by gender for Phase 3 compared to the deaths by age band.
[vi] do.
COVID-19 Action Group
The views of this article do not necessarily reflect the views of the Society of Actuaries in Ireland.