A second consecutive month with a large drop in the number of deaths relative to the previous month is cause for celebration. Nonetheless, emerging anecdotal evidence from other countries that younger people are increasingly at risk, is a reminder that we are not at the end of the pandemic path yet.
In this post we present the results of our March 2021 analysis. Our updated results are based on data from RIP.ie to 1 April 2021 and all data processing and analysis has been undertaken in line with the approach outlined in our earlier blogs.
This latest analysis highlights clearer evidence of a male bias in COVID-19 deaths in Ireland.
Analysis of deaths in Ireland
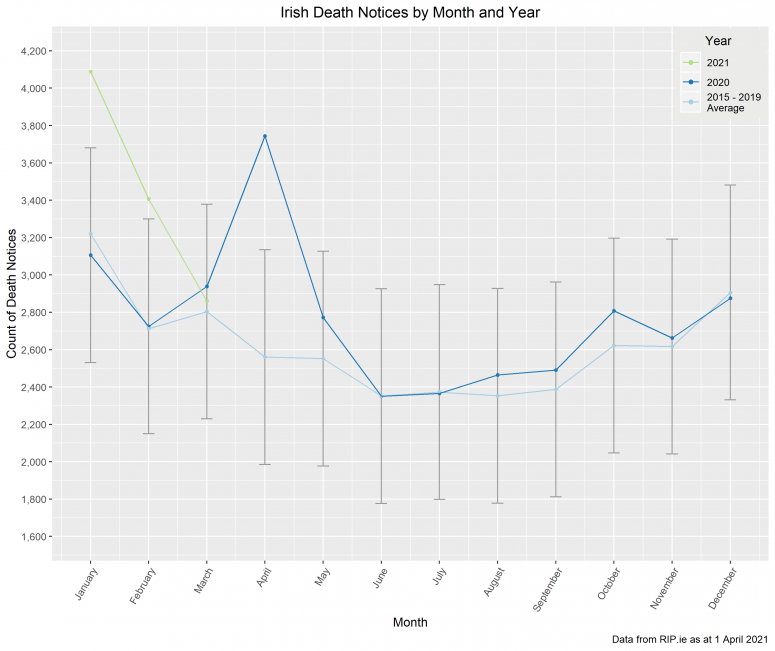
The chart below shows the number of deaths reported through RIP.ie in each month of 2020 (dark blue) and 2021 (green) against the average number reported for the same month over 2015 – 2019 (light blue). Confidence intervals of two standard deviations are included in the grey bars for perspective.

The number of deaths in the month has fallen significantly since the peak of January 2021, with a month-on-month drop in the total number of deaths of 17% in both February and March. As is clear in the chart above, a month-on-month drop is expected between January and February (average drop 16%) but there is typically a small increase between February and March (average increase 3%). Although a drop in March is not typical, the level of deaths in February was still significantly above the expected level so a drop of this magnitude is consistent with deaths returning to their “normal” levels. This is an encouraging sign, suggesting that the lockdown measures and vaccine roll-out are having the desired effect. Still, we must remember that as in much of 2020, these deaths have occurred in a lockdown environment. We need only look back to Christmas and January this year to see how significant, and potentially devastating, the reduction/absence of lockdown restrictions can be on COVID-19 infections and deaths. The vaccine roll-out should help but anecdotal evidence from countries such as Canada suggests that younger, healthier people may be starting to be hit harder by COVID-19 so we still have to be mindful of others if we want to avoid another potential spike in deaths.
Analysis by gender
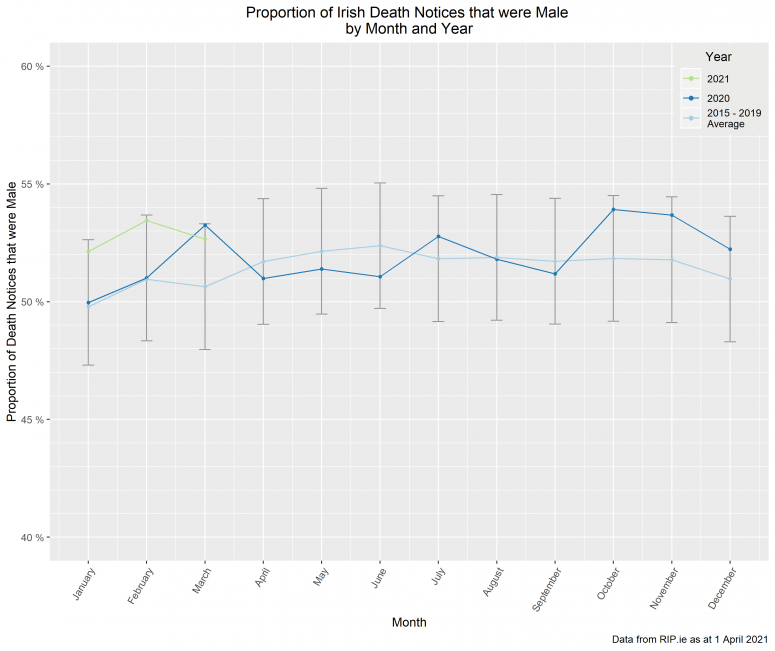
The chart below shows the percentage of death notices that were male in each month of 2020 (dark blue) and 2021 (green) against the corresponding averages from 2015 – 2019 (light blue) and confidence intervals.

The more pronounced male bias in the second-wave deaths has persisted for the sixth consecutive month. The male population is clearly experiencing a higher proportion of deaths than observed in the earlier stages of the pandemic. However, the reasons for this remain unclear, is it due to changes in the virus itself, changes in our response to it or simply changes in the impacted population (i.e. females account for a greater proportion of the older population so deaths in this group would tend to have a female bias which might have offset the virus’ apparent male bias)?
County-level gender analysis
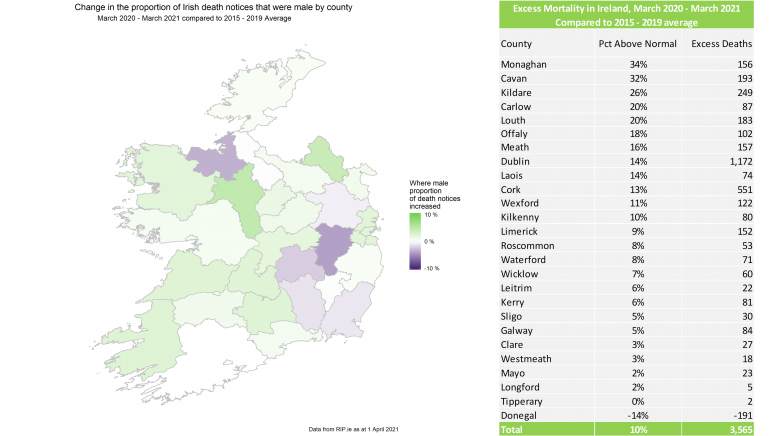
The above analysis was further examined at county level, focusing on both excess mortality and the proportion of male reported deaths from the start of the pandemic through to the end of March 2021. The following map shows the movement in the proportion of reported deaths which were male, with the excess mortality for each county in the corresponding table.

As discussed in our most recent post, the negative experience observed in Donegal appears to be a change in the way RIP.ie is used in the county rather than a real fall in deaths. Similar features have not been observed in the other counties so the above breakdown remains our best view of the county level impact (excluding Donegal) at the current time.
COVID-19 Action Group
The views of this article do not necessarily reflect the views of the Society of Actuaries in Ireland.