Despite the challenges of limiting social interaction during the darker winter days, we have persevered. We are deep into another lockdown and the impacts are starting to be visible in the data, there has been a big drop the number of deaths compared to last month. The level of deaths is still significantly higher than we would expect for this time of year so there is more work to be done both as individuals and as a Society. The arrival of vaccines offers refreshed hope but it will take time to get to everyone, now is not the time to drop our guard.
In this post we present the results of our February 2021 analysis. Our updated results are based on data from RIP.ie to 1 March 2021 and all data processing and analysis has been undertaken in line with the approach outlined in our earlier blogs.
Analysis of deaths in Ireland
The chart below shows the number of deaths reported through RIP.ie in each month of 2020 (dark blue) and 2021 (green) against the average number reported for the same month over 2015 – 2019 (light blue). Confidence intervals of two standard deviations are included in the grey bars for perspective.
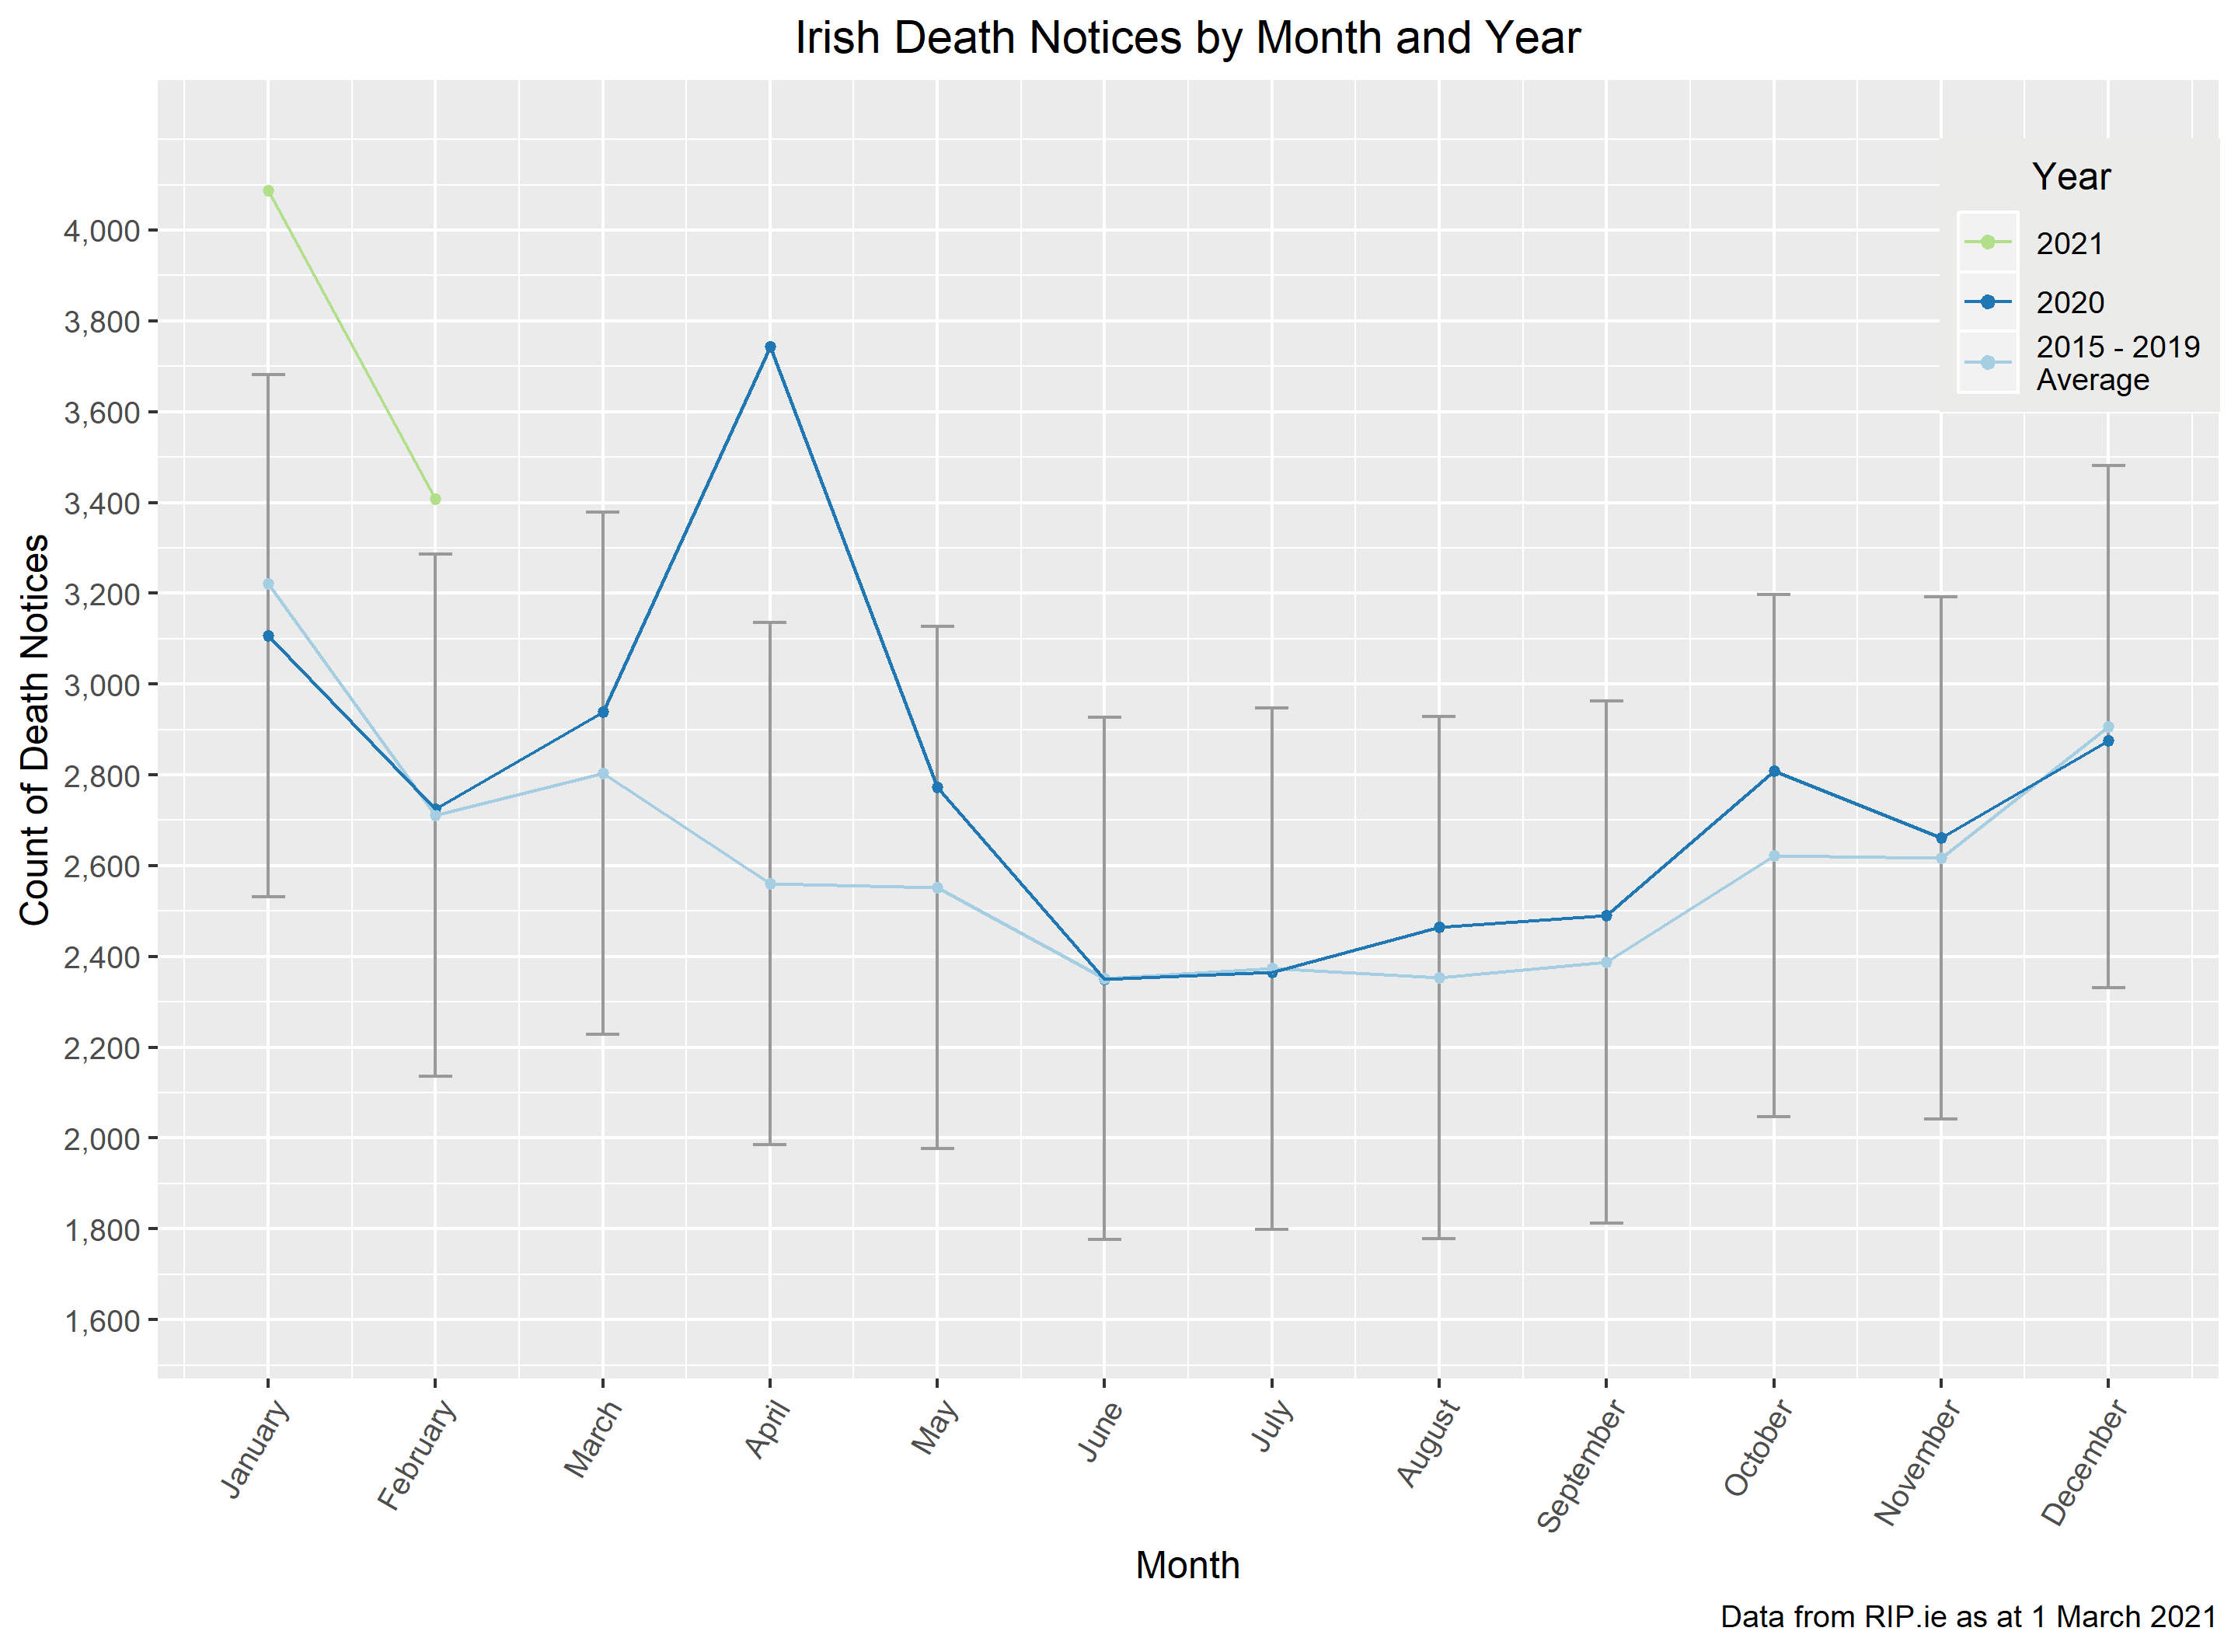
The number of deaths in the month has fallen significantly between January and February 2021, the biggest month-on-month drop since May 2020 (i.e. after the start of the first lockdown). The differences between now and May 2020 are the season/weather and the fact that February is a short month. Deaths in February are generally a good bit lower than deaths in January, whereas April and May are generally fairly similar. So we expected a drop this month regardless of external factors but nonetheless, the drop is bigger than historic experience would suggest. This is fantastic news and suggests that the lockdown measures introduced at the start of the year are working.
Despite the great progress made in February, total deaths are still significantly above the average for the month. This is the second consecutive month in which we have seen significantly higher than average deaths, visibly outside of the confidence intervals indicated in the chart. The proportional increase in deaths, relative to the average level is c.26% in February 2021 compared to c.28% in January 2021, both much lower than the c.47% proportional increase in the April 2020 peak.
As the daylight hours lengthen and outside temperatures rise, the number of deaths would normally fall. Combining this with ongoing social distancing, travel restrictions and the gradual roll-out of a vaccine, should bring the level of deaths back to its “normal” level. However, after a year of restrictions, the weather tempts us outside (which is good) but also tempts us to interact with more people. The pace at which the level of excess deaths drops will depend on a number of factors, most notably the speed and take-up of the vaccination program, the emergence of any vaccine-resistant variants and our individual commitment to the ongoing restrictions. Which of these will dominate the coming months is impossible to say but we will explore the overall impact in the analysis in future posts.
Analysis by gender
The chart below shows the percentage of death notices that were male in each month of 2020 (dark blue) and 2021 (green) against the corresponding averages from 2015 – 2019 (light blue) and confidence intervals.
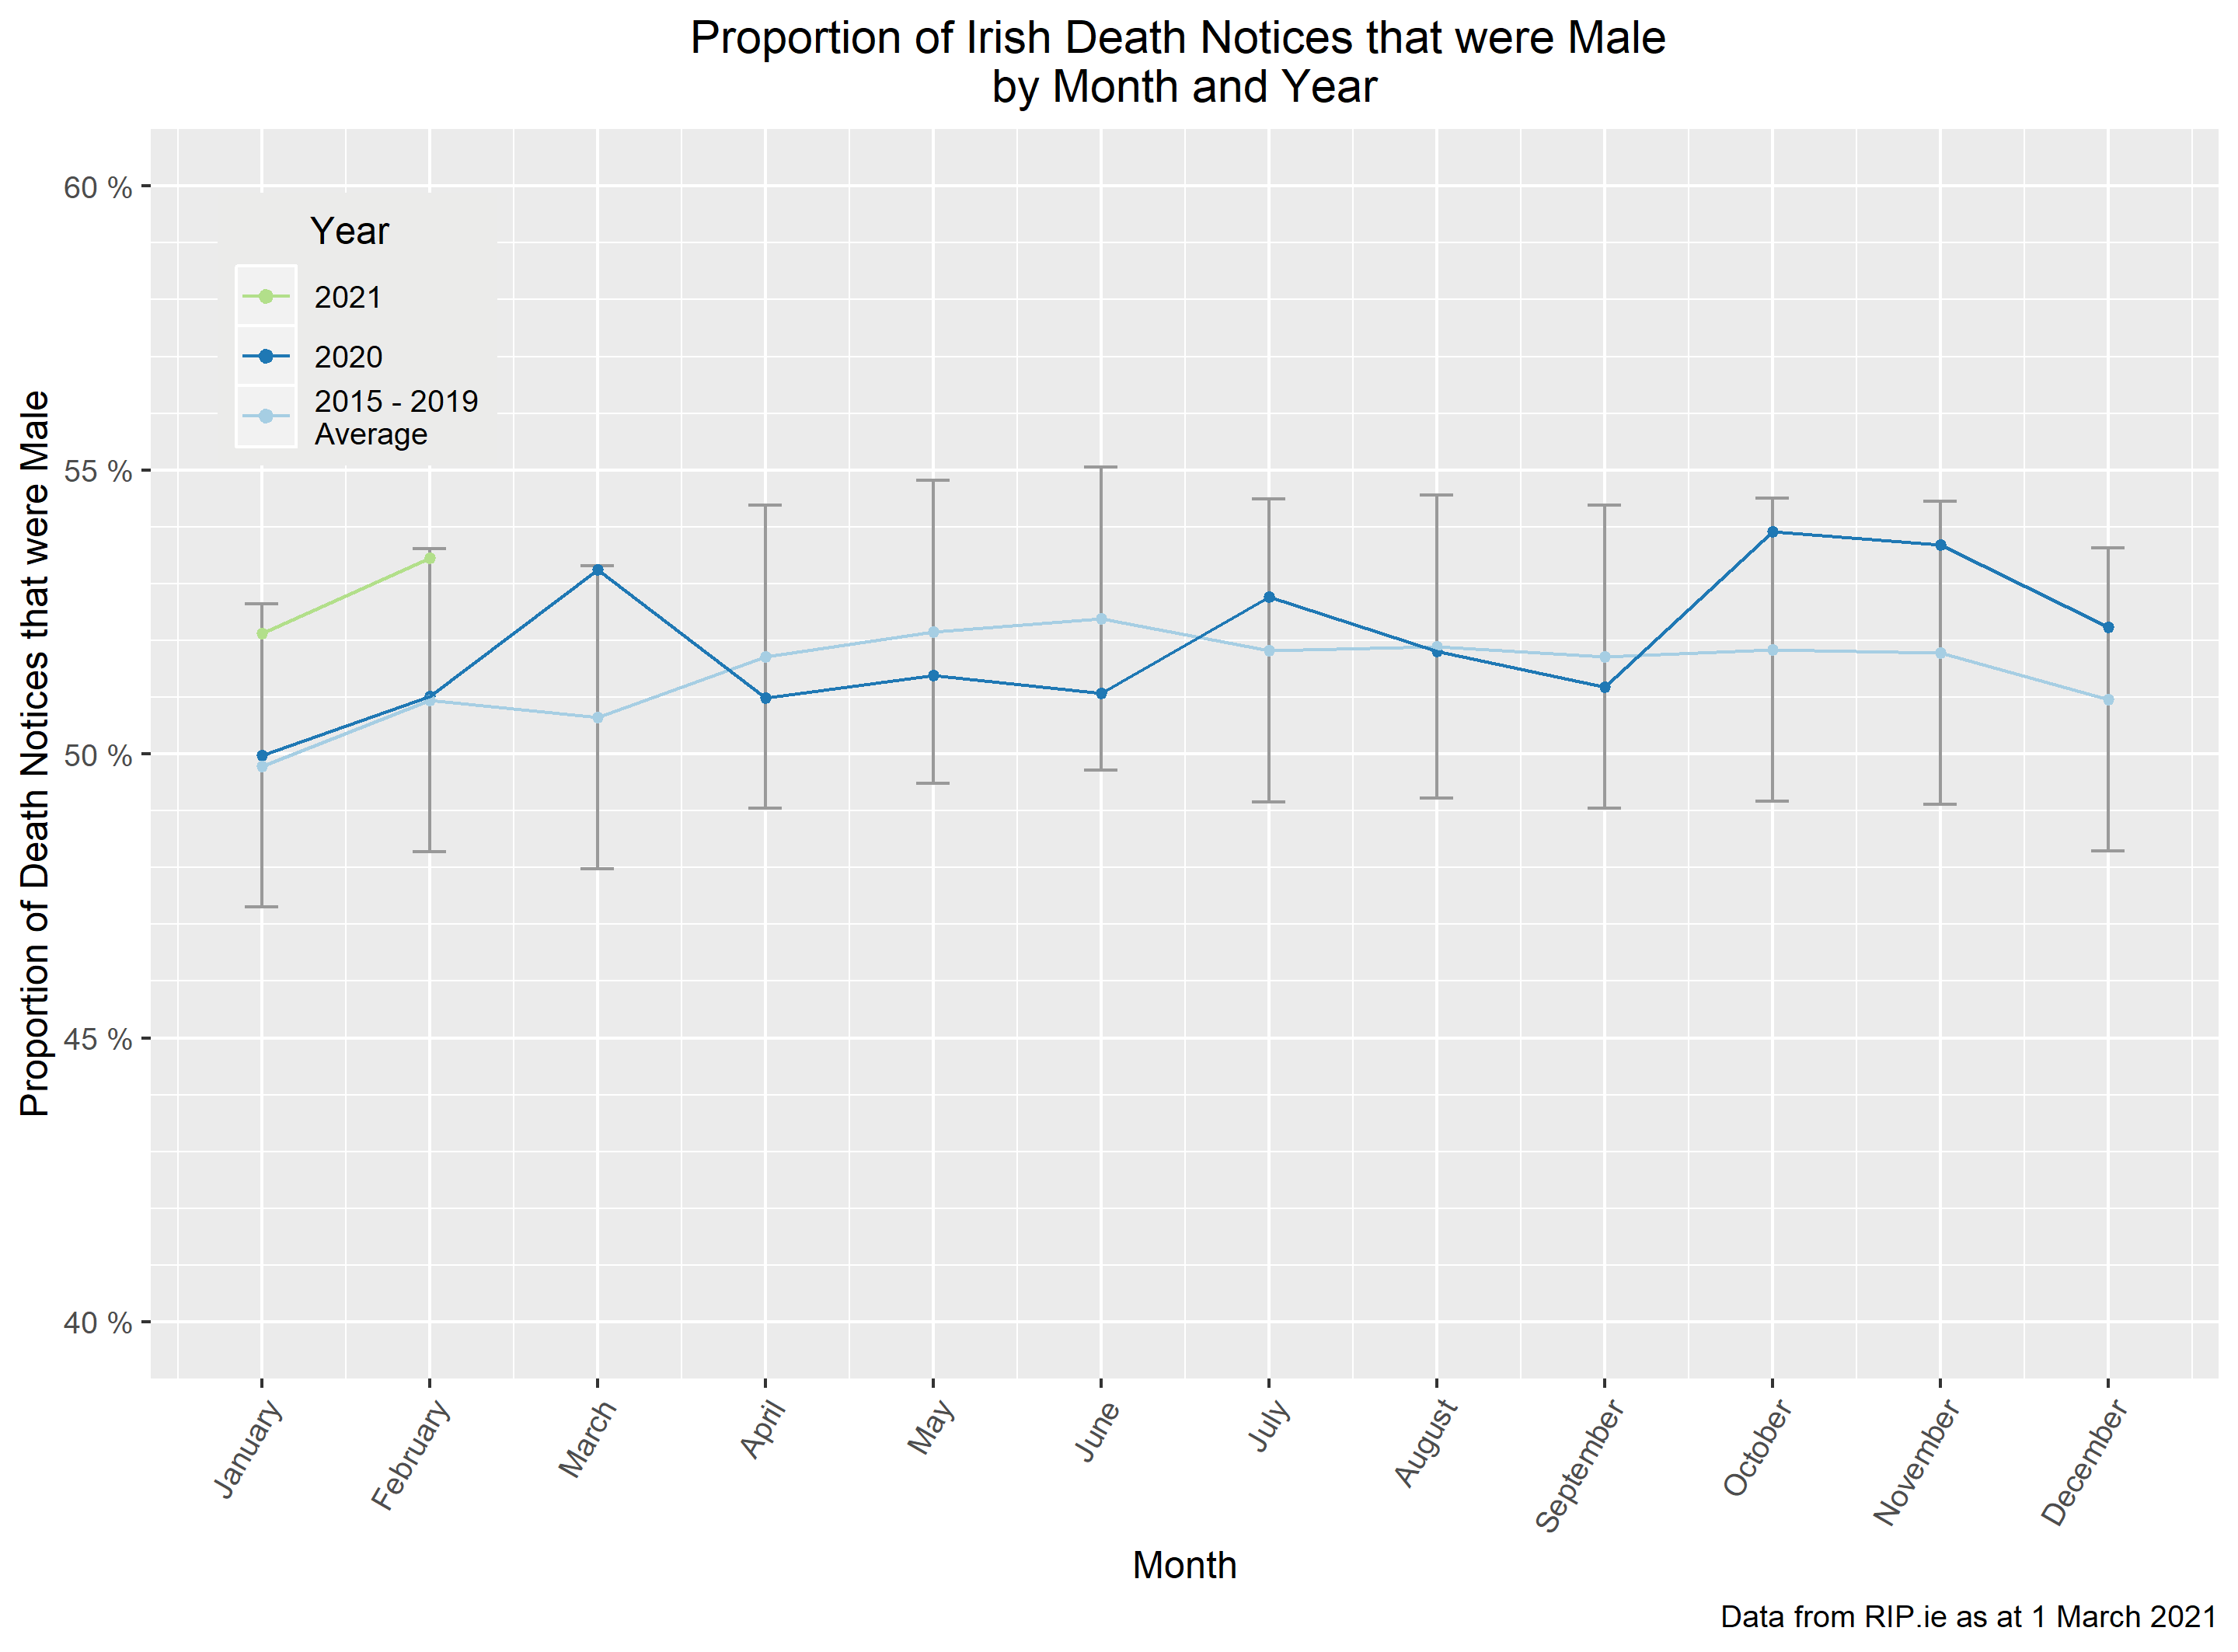
The more pronounced male bias in the second-wave deaths has persisted for the fifth consecutive month. At this stage, it is difficult to draw any conclusion other than that the second wave of COVID-19 is hitting the male population harder (in respect of deaths, we leave financial, professional and societal impacts to others to comment on). What this data does not tell us is whether men are more likely to die from the virus if they get it (i.e. a bias in the virus itself or male immunity) or whether men are dying in greater numbers because they are more likely to get it in the first place (i.e. a bias in the cultural/societal/workplace responses to the virus).
The first couple of months of the year are typically the least gender biased due to higher volumes of deaths in the older population (the proportion of females is higher at older ages which offsets the natural level of male-bias in deaths). This is clear from the light blue line in the graph above and the dark blue line shows that 2020 did not diverge from this pattern. The proportion of reported deaths that were male in the first 2 months of 2020 was 50% which is consistent with the 5 year average considered throughout our analysis. The corresponding period of 2021 has shown a marked increase in the gender bias with 53% of the deaths reported being male.
Notwithstanding the above comments, if we consider the longer period over which the graph above indicates that the increased male bias has been present (i.e. October 2020 to February 2021), the jump in 2021 is still apparent but is not as stark. The 5-year average male proportion for this period[1] is 51%, the corresponding male proportion for last year (i.e. October 2019 to February 2020) is 52% and the male proportion for the current period is 53%. Considering this pattern, it is possible that the male bias in the winter months was increasing before COVID-19 became a factor. Alternatively, it is possible that the winter of 2019-2020 included a number of undiagnosed COVID-19 deaths as the world became aware of the new virus.
County-level gender analysis
The above analysis was further examined at county level, focusing on both excess mortality and the proportion of male reported deaths from the start of the pandemic through to the end of February 2021. The following map shows the movement in the proportion of reported deaths which were male, with the excess mortality for each county in the corresponding table.

Donegal has been consistently showing negative excess deaths throughout the pandemic. As this is unexpected over such a sustained period, we have investigated further. Preliminary results of this investigation indicate that this is not a reflection of an unusually low number of deaths in Donegal during 2020-2021 but rather due to a change in way the people of Donegal (or the funeral directors of Donegal) announce deaths. There has been a noticeable drop in the volume of Donegal deaths recorded on RIP.ie but the same drop has not been seen in other sources (albeit they lag 6+ months behind RIP.ie). A separate blog post on this particular feature will be published soon.
COVID-19 Action Group
The views of this article do not necessarily reflect the views of the Society of Actuaries in Ireland.
[1] Considering October, November, December, January and February reported deaths between October 2014 and February 2019