We all knew beforehand that the excesses of the festive period would cause a spike in COVID-19 infection. Nonetheless, the magnitude of the spike seen and the extent to which it has translated into increased hospitalisations and ultimately deaths is shocking. As individuals we must personally consider how our behaviour impacts COVID-19 prevalence, our health service and society as a whole. As actuaries we must consider to what extent this cause-and-effect pattern and the general ongoing uncertainty needs to be reflected in our day to day work.
In this post we present the results of our January 2021 analysis and reflect on the final month of a year that few are likely to forget.
Our updated results are based on data from RIP.ie to 1 February 2021 and all data processing and analysis has been undertaken in line with the approach outlined in our earlier blogs.
Analysis of deaths in Ireland
The chart below shows the number of deaths reported through RIP.ie in each month of 2020 (dark blue) and 2021 (green dot) against the average number reported for the same month over 2015 – 2019 (light blue). Confidence intervals of two standard deviations are included in the grey bars for perspective.
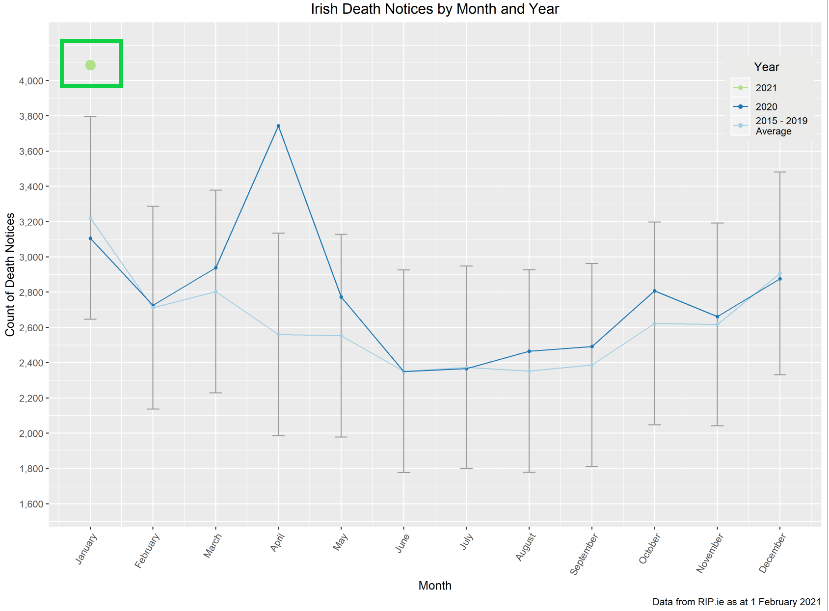
The second half of 2020 saw a consistent pattern of an above-average number of deaths, this level of excess deaths was not more than the fluctuations we might observe from year to year. The same cannot be said for January 2021 which saw a significantly higher number of deaths than average – indeed, this is the first month since the peak of the first wave in April 2020 the number of deaths in the month has been outside our confidence interval range. It is also the highest absolute number of deaths in a single month since our analysis began, although it is worth noting that January would normally see a higher number of deaths than at any other time of the year. The proportional increase in January 2021 is c.28% compared to c.47% in April 2020.
In our previous post we suggested that with winter influenza cases much less prevalent this year, one could argue that the usual seasonal spike in deaths was simply replaced by COVID-19 related fatalities, and deaths due to other causes were in line with expectation. HSE tracking continues to show no evidence of winter influenza in the population of Ireland[1] but death experience in January 2021 shows that COVID-19 fatalities, rather than replacing seasonal influenza deaths, have far exceeded them. In fact, this means that the number of deaths due to COVID-19 is likely far greater than the difference between the observed number of deaths and the historical average.
The arrival of the more virulent, and potentially more deadly, UK variant of COVID-19 as well as the emergence of other variants, will have compounded the impact of the increased social interactions over the festive period. Whether the lockdown measures introduced in January have been enough to stem the tide or whether this wave will continue for some months will be clearer from the February data. This is something we will explore in our next post.
Analysis by gender
The chart below shows the percentage of death notices that were male in each month of 2020 (dark blue) and 2021 (green dot) against the corresponding averages from 2015 – 2019 (light blue) and confidence intervals.
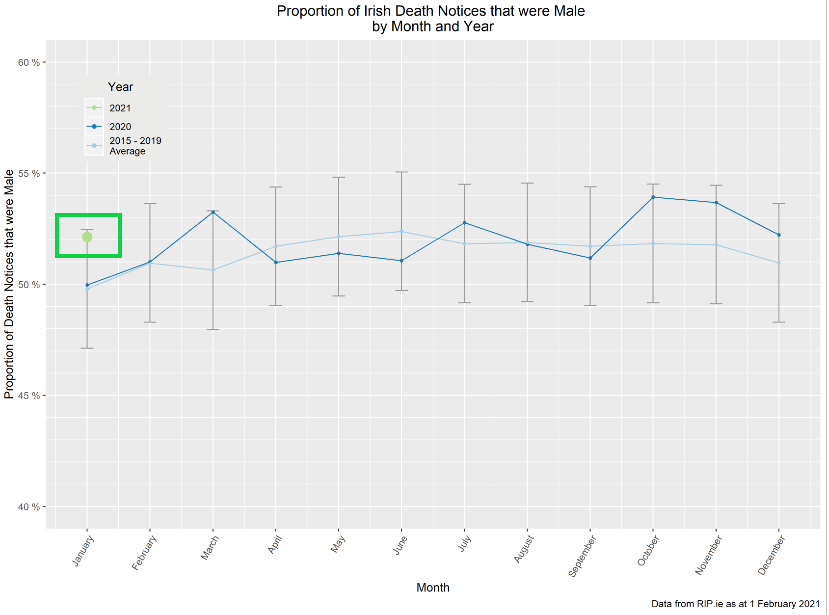
In our previous posts we observed that the second wave appeared to have a male bias although the reason for this was unclear. This divergence is more pronounced in January 2021 with the relative increase in bias (compared to the normal bias in the average deaths) at its highest since March 2020. Additionally, the persistent evidence of bias over multiple consecutive months suggests that this wave is different, either in terms of the virus itself or in terms of the way in which men and women are responding to it.
The proportion of reported deaths that were male over the whole of 2020 was c.52% while the 5-year average over the same period of the year is c.51%. The corresponding proportion for January 2021 is c.52%, consistent with the overall 2020 experience.
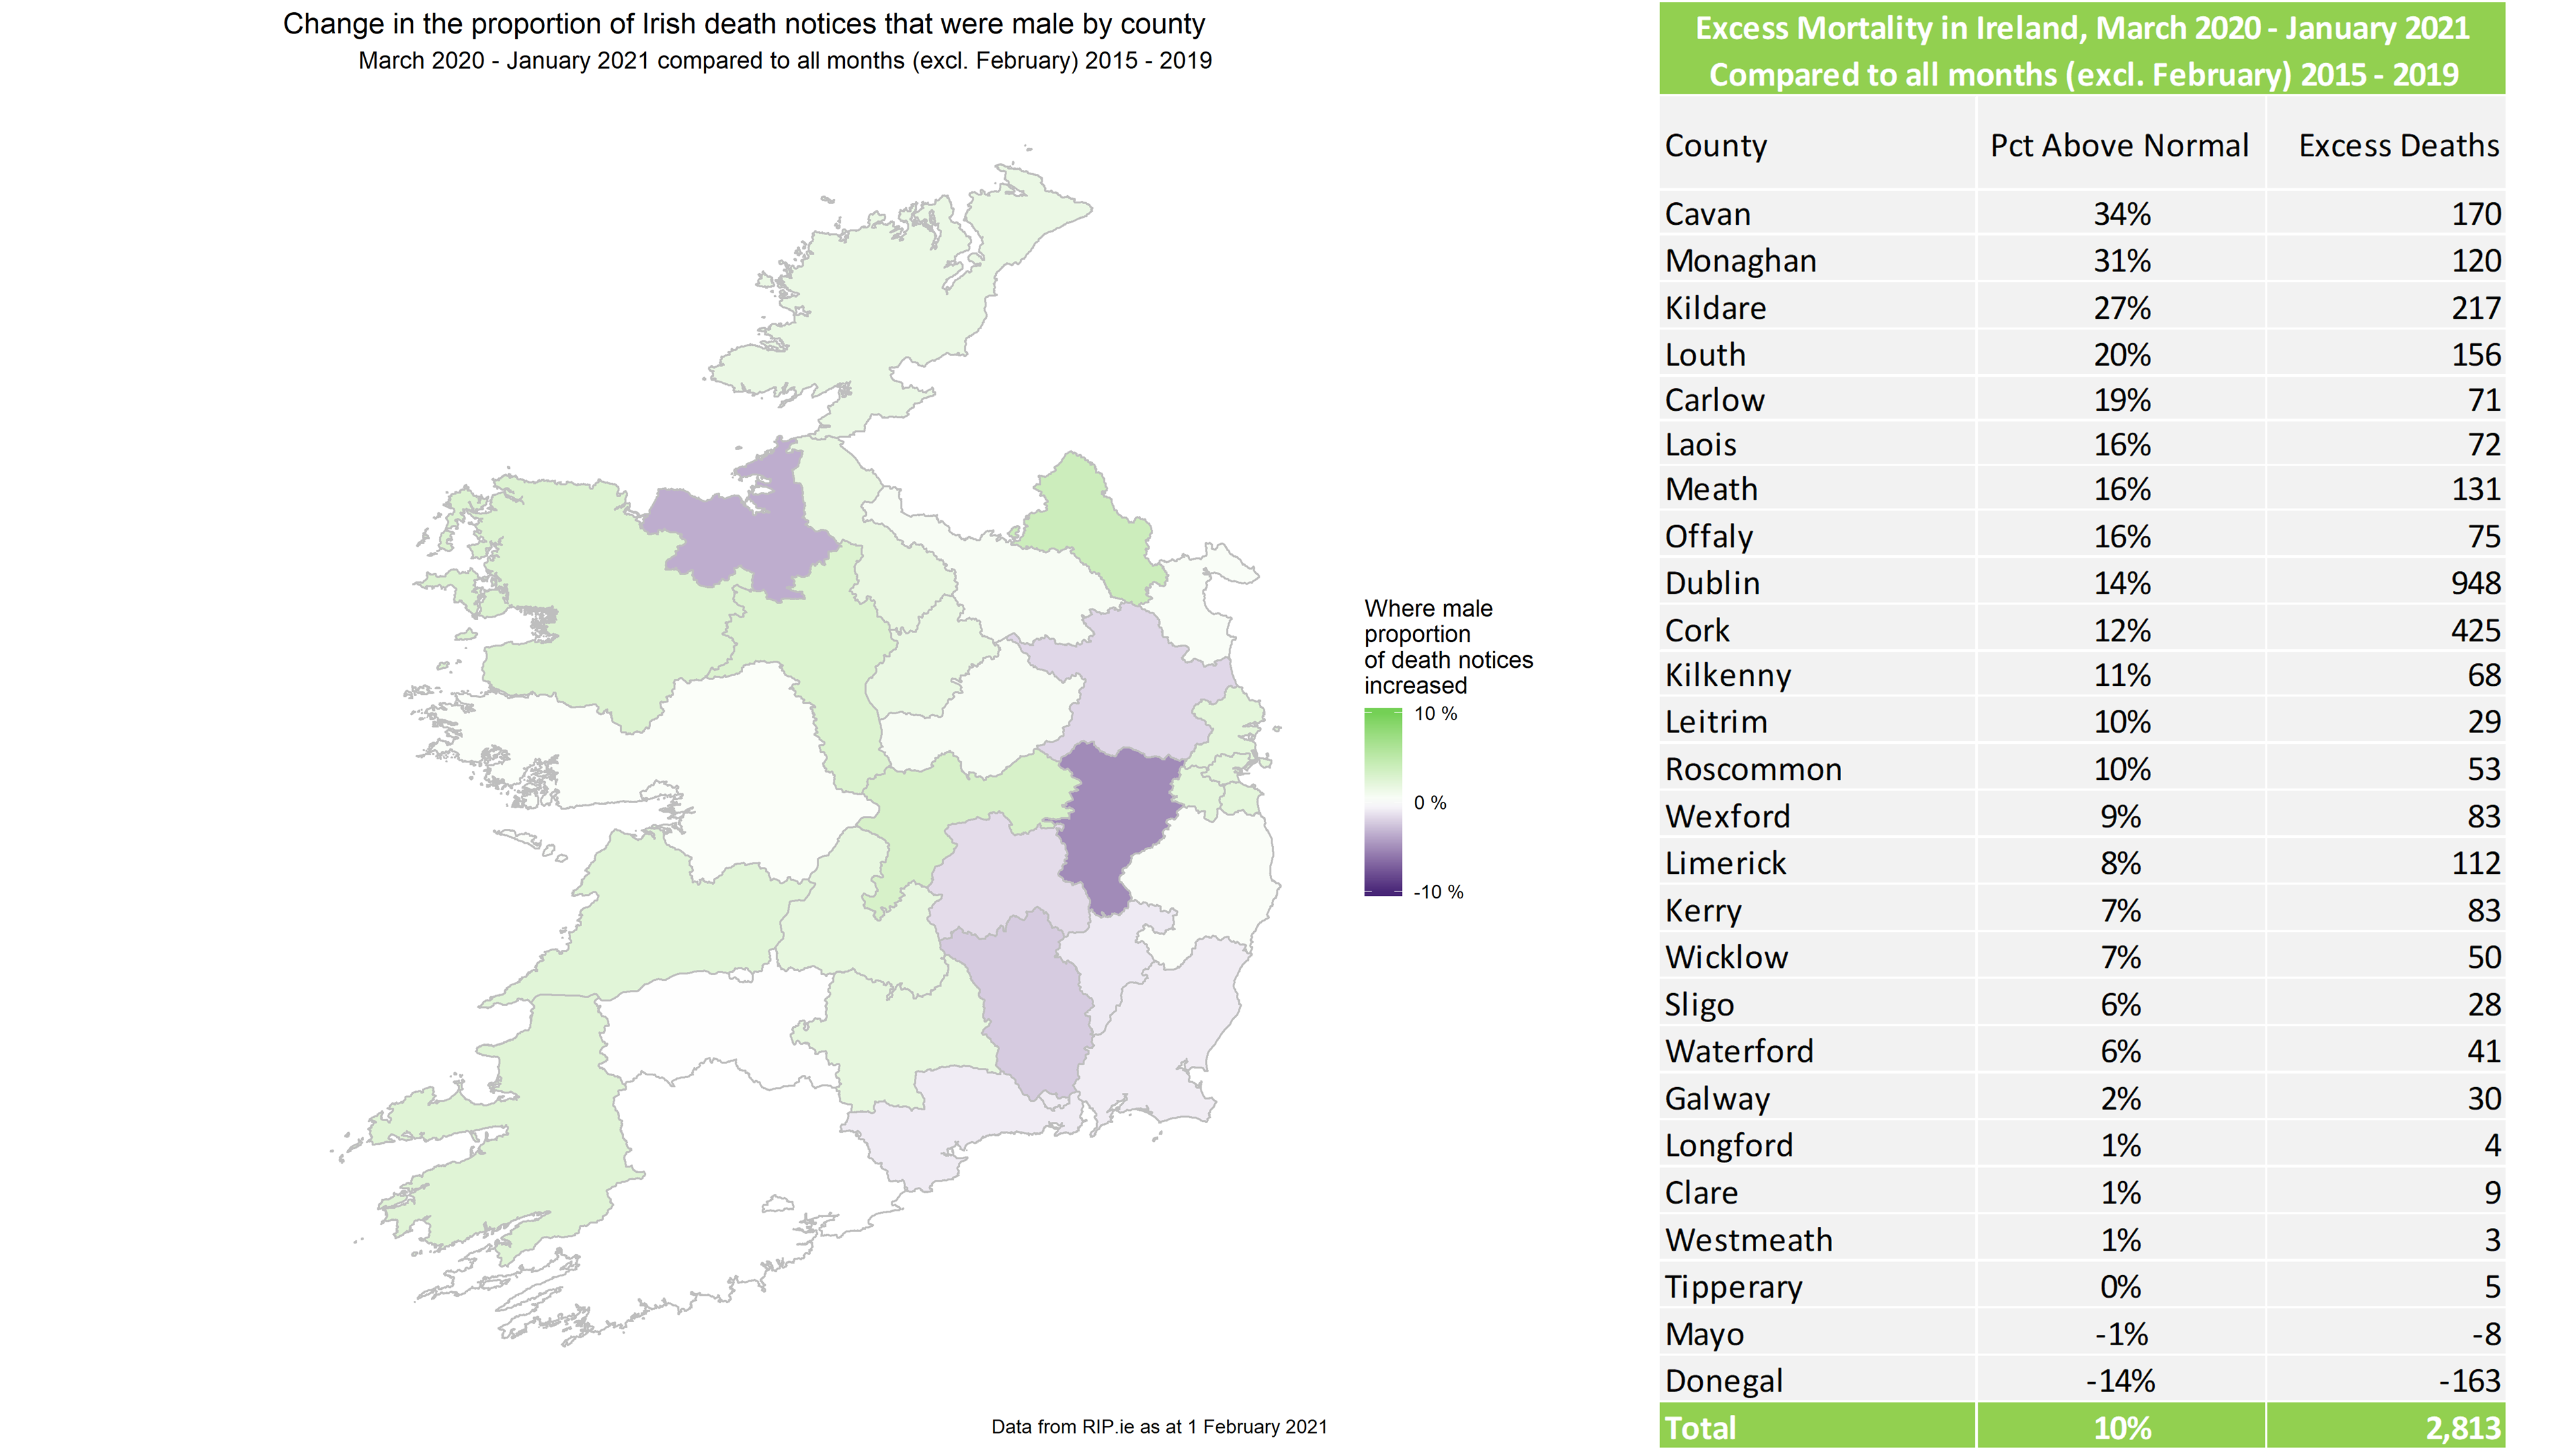
County-level gender analysis
The above analysis was further examined at county level, focusing on both excess mortality and the proportion of male reported deaths from the start of the pandemic through to January 2021. The following map shows the movement in the proportion of reported deaths which were male, with the excess mortality for each county in the corresponding table.
COVID-19 Action Group
The views of this article do not necessarily reflect the views of the Society of Actuaries in Ireland.
[1] There was no evidence of influenza viruses circulating in the community in Ireland during week 5 (week ending 07/02/2021) or during the period from week 40 2020 to week 4 2021. Source: Influenza Surveillance in Ireland – Weekly Report