In this post we present the results of our December 2020 analysis and reflect on the final month of a year that few are likely to forget.
Early December saw the easing of restrictions after a six-week period of lockdown, with a swift return to level 5 before the month had ended, in response to increasing infection rates. We examine the excess mortality during this period and consider the impact on the year-to-date results.
Our updated results are based on data from RIP.ie to January 1, 2021 and all data processing and analysis has been undertaken in line with the approach outlined in our earlier blogs.
Analysis of deaths in Ireland
The chart below shows the number of deaths reported through RIP.ie in each month of 2020 against the average number reported for the same month over 2015 – 2019. Confidence intervals of two standard deviations are included in the grey bars for perspective.
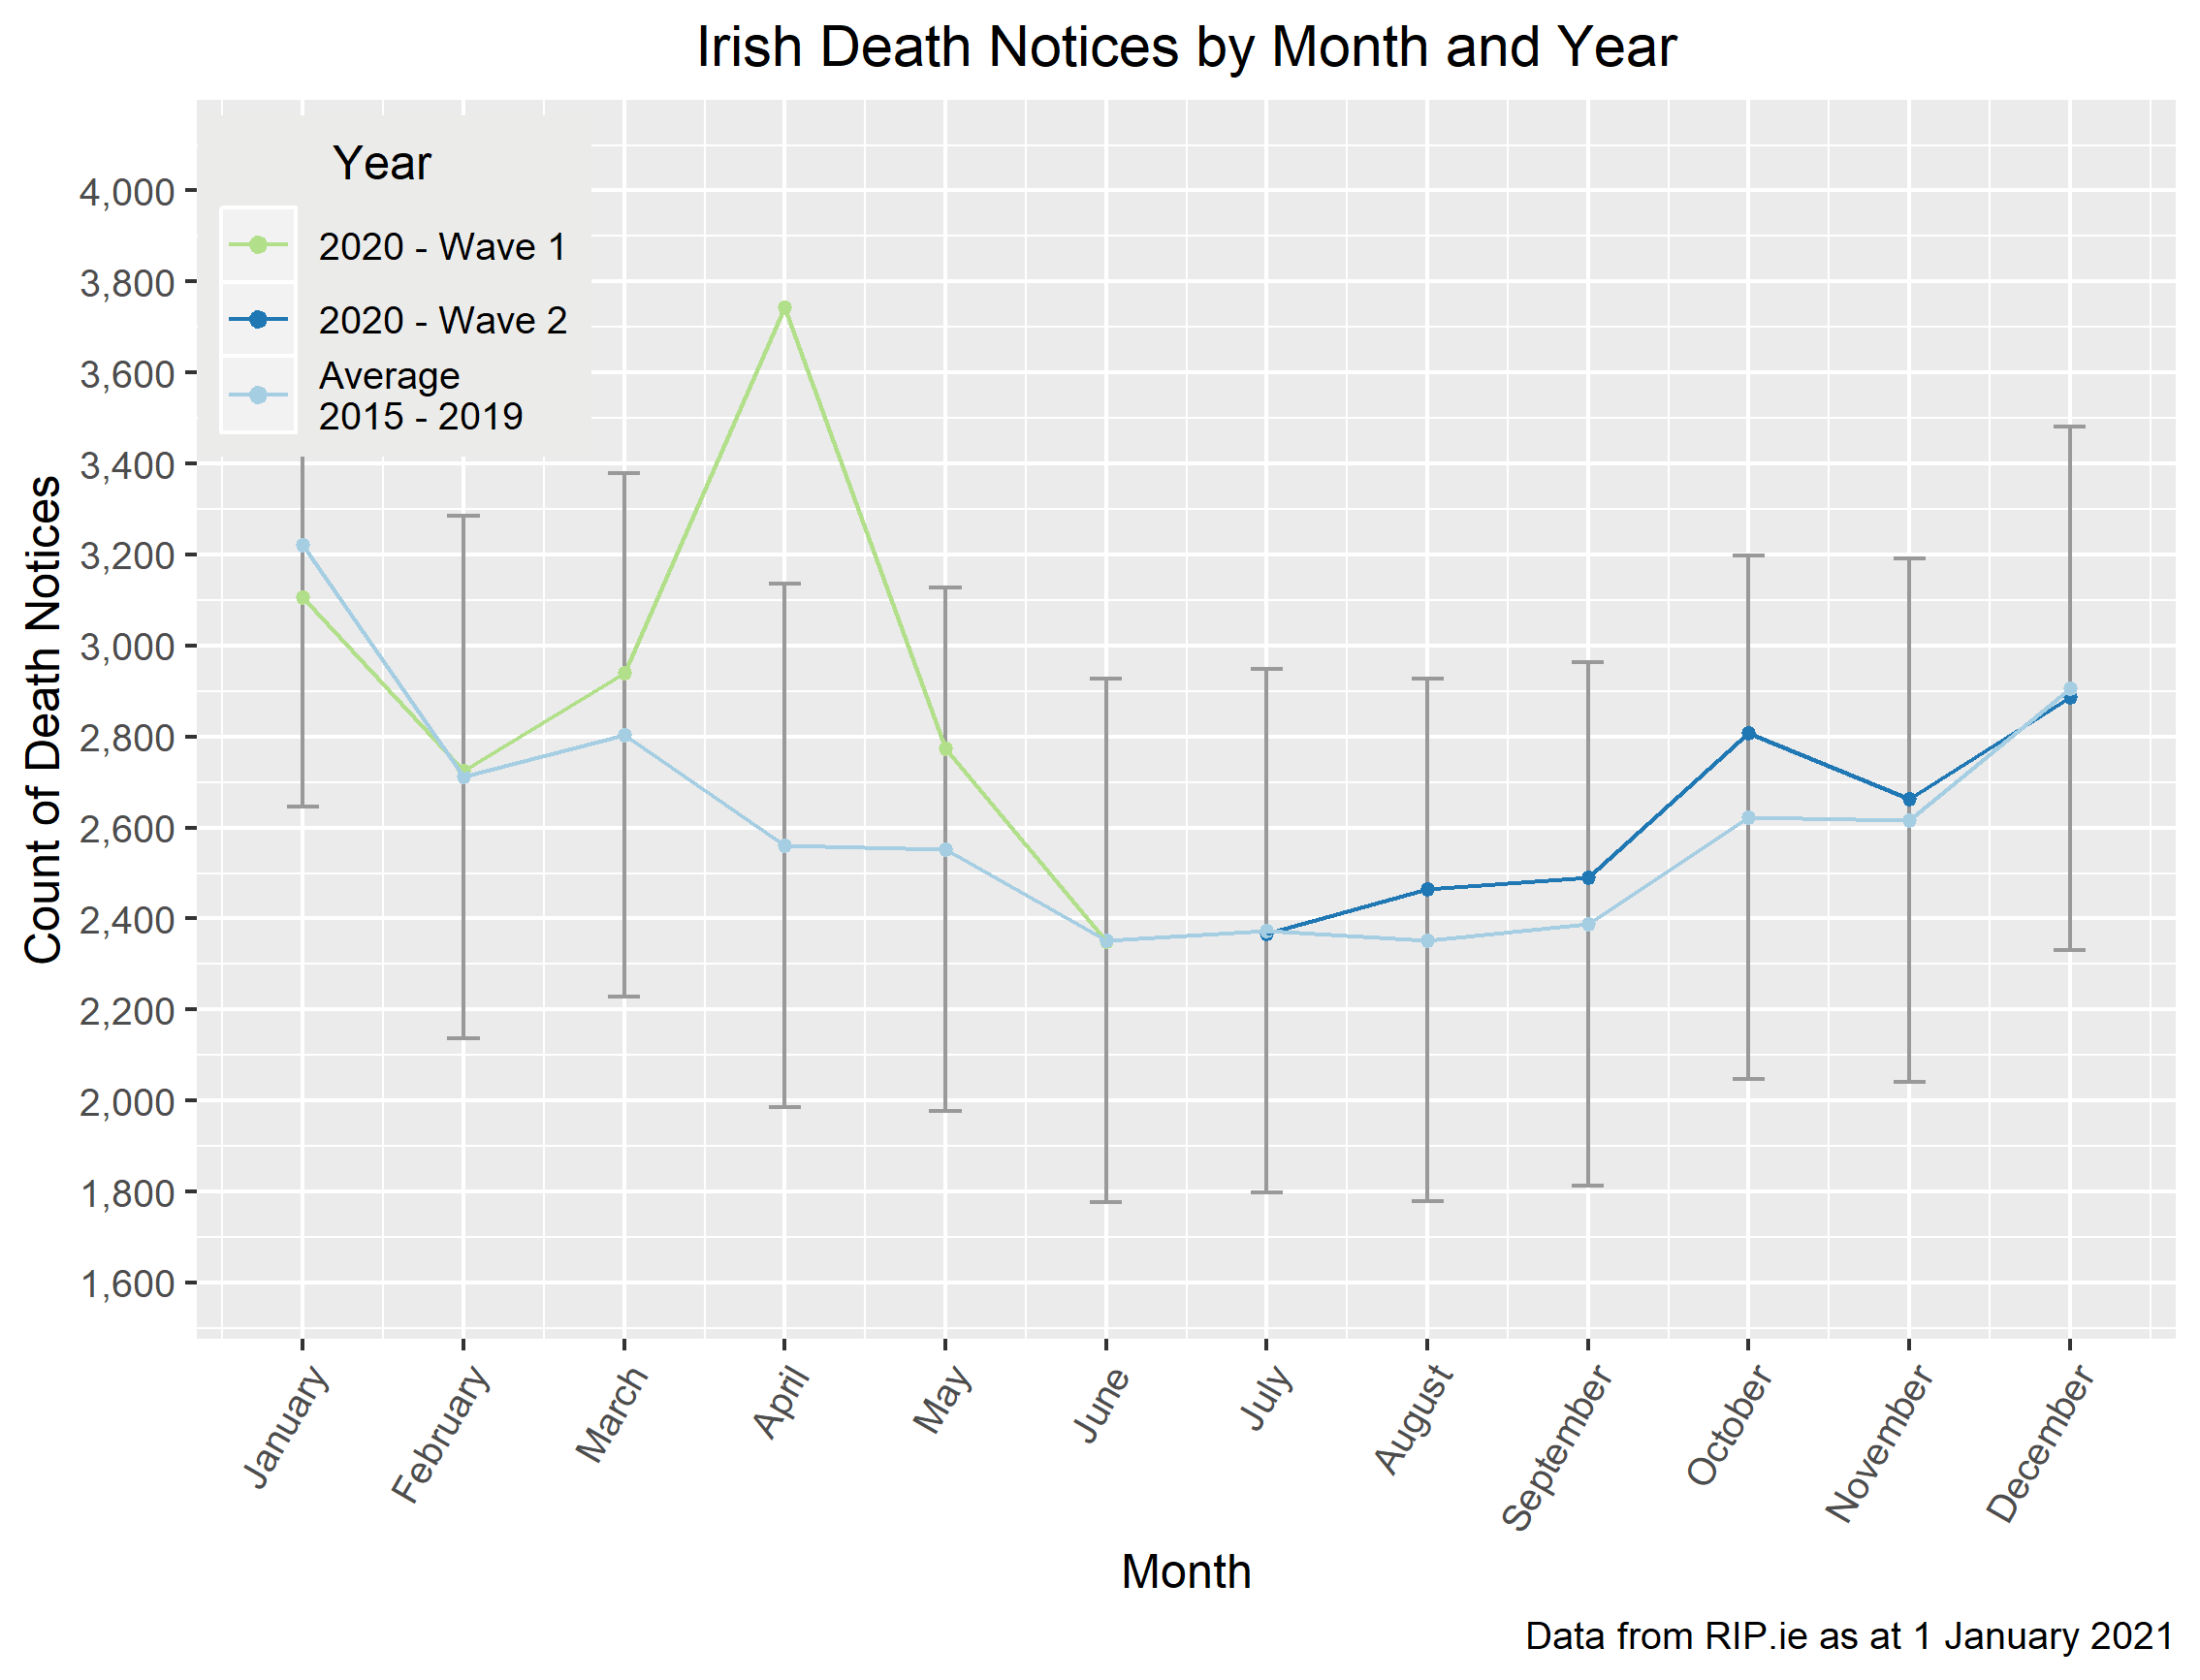
The December experience for 2020 converged on the average 2015-2019 deaths, with the total deaths falling to marginally below the five-year average. In the absence of winter influenza cases recorded this year[1], one could argue that the usual seasonal spike in deaths was simply replaced by COVID-19 related fatalities, and deaths due to other causes were in line with expectation.
The arrival of the more virulent UK variant of COVID-19, together with the easing of restrictions during the festive period and figures reported to date by the HSE/NPHET, suggest higher deaths can be expected for January. However, as the graph above shows, January typically has the highest deaths of the year so whether the level of excess deaths will be greater than in other months of the pandemic is something we will explore in our next post
Analysis by gender
The chart below shows the percentage of death notices that were male in each month of 2020 against the corresponding averages from 2015 – 2019 and confidence intervals.

In our previous posts we observed that the second wave appeared to have a male bias although the reason for this was unclear. We saw a divergence in the year-to-date proportion versus the 5-year average during October and November, which has continued into December with c.53% of second wave deaths recorded as male. However, the difference remains within the range for normal variation so while a gender bias in COVID deaths looks more likely than during the first wave, it may just be normal fluctuations.
Considering the impact of the December data on the overall experience of 2020 to date, the proportion of reported deaths that were male remains at c.52% while the 5-year average over the same period of the year is c.51%. The difference is within the range for normal variation, but we continue to note a divergence in the year-to-date proportion versus the 5-year average.
County-level gender analysis
The above analysis was further examined at county level, focusing on both excess mortality and the proportion of male reported deaths to December 2020. The following map shows the movement in the proportion of reported deaths which were male, with the excess mortality for each county in the corresponding table.

Similar to previous posts, the trends in these visualisations are largely stable, with counties at the top and bottom of the list remaining relatively unchanged. On average, the year-to-date excess mortality for each county was c.1% lower than observed in our last post. Laois recorded a decrease in year-to-date excess deaths from 18% to 13%, and Donegal continues to experience notably lower than average mortality.
COVID-19 Action Group
The views of this article do not necessarily reflect the views of the Society of Actuaries in Ireland.
[1] There was no evidence of influenza viruses circulating in the community in Ireland during weeks 52 (week ending 27/12/2020) and 53 2020 (week ending 03/01/2021) or during weeks 40-53 2020. Source: Influenza Surveillance in Ireland – Weekly Report