Different approaches to measuring excess mortality
As we pass the one-year anniversary since the first deaths relating to Covid-19 in Ireland we have all sadly become accustomed to hearing the daily updates on the latest case and death figures. Over the last year there have been many discussions on how the virus has impacted society and in particular the number of deaths. The terms “excess mortality” and “excess deaths” have become commonplace with mainstream press and commentators (e.g. RTÉ, Irish Times and Independent) using the concept to illustrate the total impact of the pandemic on deaths in Ireland.
By definition, excess mortality is the number of deaths occurring in a period over the number of deaths expected in a “normal” period. Although the concept of excess mortality has become commonplace, the approach to measuring the expected deaths remains an area of judgement with no single methodology having yet emerged as the preferred approach.
The different approaches, time lags in reporting deaths and the time period chosen in the calculation can lead to a range of excess mortality figures being derived. Therefore, the conclusions drawn from the results may be impacted by choices made in the analysis. For example, a recent article by the Journal.ie outlined how conclusions on whether there was any excess mortality in the 2020/21 winter months can change due to the delay in death registrations.
The approach we have adopted in all our previous posts is to define the expected deaths for any given month as the average of the actual deaths which have occurred in the corresponding month in each year 2015-2019 inclusive (i.e. a 5-year average). Other statistical and actuarial bodies have defined the expected deaths based on multi‑year averages of varying lengths, single year comparatives[1] or standardised/population-adjusted comparatives[2]. In this post, we consider the relative merits of these approaches and the impact of the choice of approach on excess mortality.
Consistent with our prior posts, the analysis in this post has not been adjusted for trends in mortality over time or the changing size or age shape of the population except for the analysis explicitly considering the impact of population growth.
Analysis in this post makes use of data from RIP.ie which does not typically specify cause of death so COVID and non-COVID deaths cannot be differentiated. Therefore, consistent with our previous posts, any reference to excess mortality in this analysis refers to ‘all-cause’ mortality. This will include the combined impact of higher deaths from some causes (e.g. COVID-19) and potentially lower deaths from other causes (e.g. workplace accidents).
Multi-year averages
Multi-year comparatives smooth out annual fluctuations in mortality experience producing a more stable measurement of “expected” deaths which is desirable. However, the inclusion of multiple years also smooths out the effects of change in the mix of the population in respect of age, gender or other mortality factors. This feature is less desirable, particularly if the mix of the population is trending in one direction or the other.
Finding a balance between the desirable and less desirable consequences of using a multi-year average is a key consideration when determining how many years to use in the average. Too many years and the undesirable consequences outweigh the desirable ones, but too few years and the desirable consequences are limited or lost. The other key consideration is the reliability of the data itself as older data tends to be less complete and credible than recent data.
In our previous posts we have adopted a 5-year average, primarily due to the credibility of the data. As discussed in our first post, we found that RIP.ie data was a reasonable match to published CSO data for the period 2015-2018 (2019 CSO data was not available at the time of our first post) but less aligned for earlier years. Therefore it seemed reasonable to use all available data from 2015 onwards for our analysis. Other statisticians and academics have independently formed their own judgements on this and have reached different conclusions. For example Dr Padraig MacCarron concluded that a 10-year average of RIP.ie data is reasonable whereas the CSO itself concluded that 2-3 year average of RIP.ie data is reasonable.
The chart below shows the extent to which expected deaths vary based on the choice of analysis period. The chart illustrates the impact on total excess mortality in 2020 and on 12 month pandemic periods starting in March and April 2020 respectively.
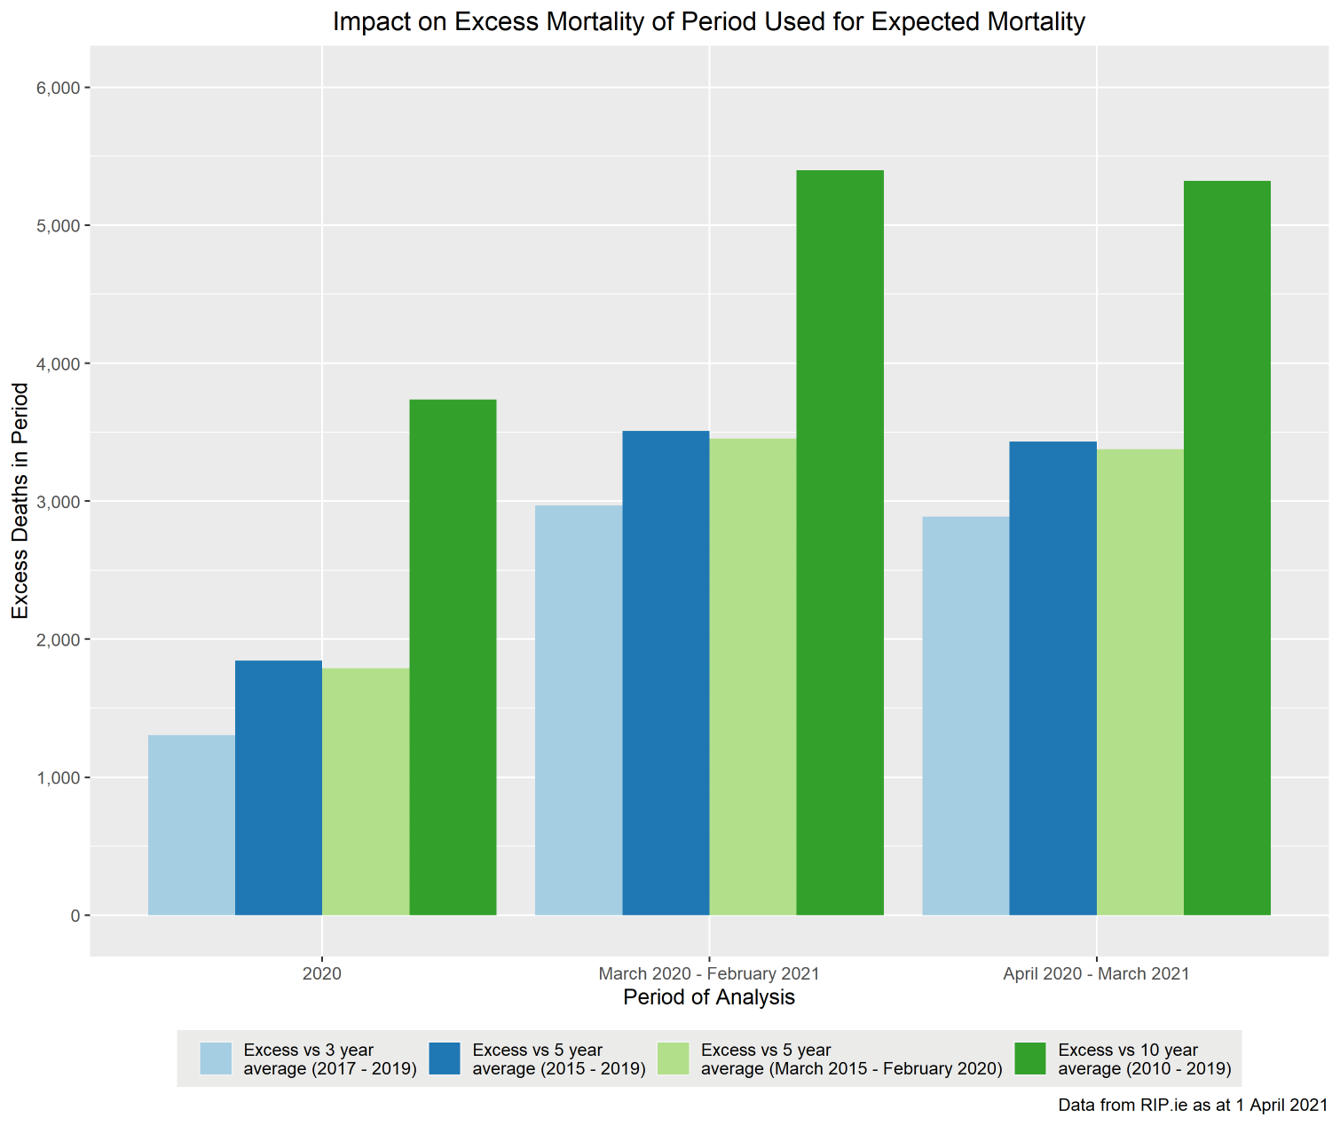
There is a difference of approximately 500 deaths between the 3-year and 5-year approaches with a difference of approximately 2,000 deaths between the 5-year and 10-year approaches. This is partly due to the different mix of the higher and lower mortality years during the period but it primarily reflects the generally increasing number of deaths year-on-year as the population is growing (i.e. generally more people means more deaths regardless of other factors).
Single year comparative
A single year comparative may reflect the current population size and mix more closely, particularly if the year chosen is the most recent year considered to be unaffected by the pandemic. However, it does not allow for any smoothing of annual fluctuations in mortality. Therefore excess mortality using this approach is sensitive to the underlying mortality specific to this year, and any trends observed.[3].
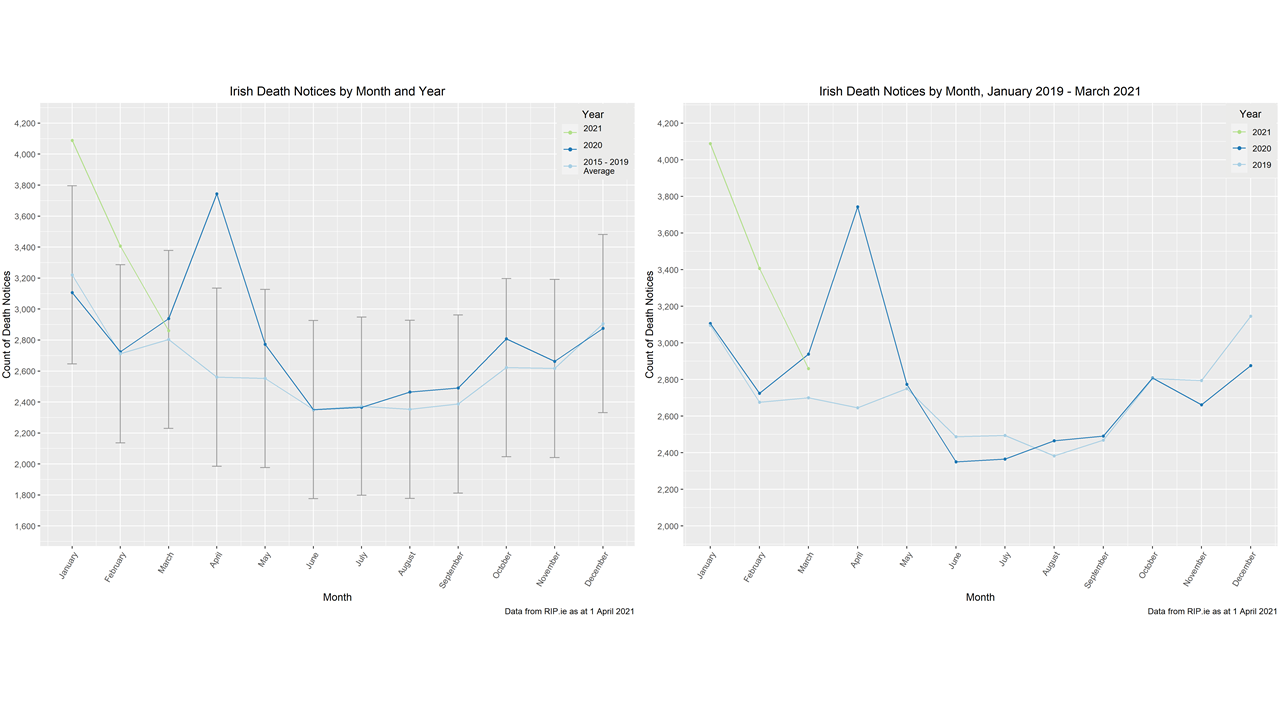
The charts below show the potential impact of using a single year comparative rather than a multi-year average. The chart on the left is taken from our regular analysis post up to March 2021, the chart on the right is the same data but taking 2019 as the expected level rather than 2015-2019. While there are variations month-on-month, mortality in 2019 was heavier overall than the 5 year average and consequently excess mortality observed during the pandemic period is lower. Total excess mortality in 2020 is 1,857 when measured against our standard 5-year average but only 868 when measured against 2019.
Population-adjusted comparative
The analysis and results included in our previous posts make no allowance for changes in the underlying population of the country. In the single year comparative above, the choice of a single, recent year as the comparative allows the underlying population to be more closely reflected but it still excludes recent changes and, as discussed above, it has other drawbacks.
An alternative approach is to adjust the comparative to reflect the changes in the population between the year(s) used for comparison and the year being analysed. The question is what should we be adjusting for?
The charts below are derived from CSO published population data for Ireland[4]. The chart on the left shows a clear increasing trend in the total population size, this has varied between 1.1% and 1.3% per annum over the period (averaging 1.2%). The same chart shows that the gender split of the population has not changed over the period, with males accounting for c.49.5% of the population. Similarly, the chart on the right shows no significant change in the age mix of the population.

Given the trends shown in the charts above, it seems reasonable to adjust the comparative to reflect overall population growth, but not changes in the gender split or age mix of the population. We explore the impact of applying such an adjustment in the section below. However, caution should be exercised when considering these results because they allow for population growth (which increases the expected number of deaths) but they do not allow for mortality improvements over the same period (which decrease the expected number of deaths).
The population growth adjustment can be applied to either single or multi-year comparatives but for ease of comparison with our previous posts, we have considered the impact of applying this to the 2015-2019 average we have adopted to date.
The chart below shows the impact on expected deaths of adjusting the 2015-2019 average to reflect the change in the population over the period to 2020/2021. For 2020, the adjustment applied is a ratio of the average population in 2015-2019 to the population in 2020 as published by the CSO. For 2021, the CSO has not yet published population figures so the adjustment assumes that the increase between 2020 and 2021 is the same as the increase between 2019 and 2020 (i.e. 1.1%).
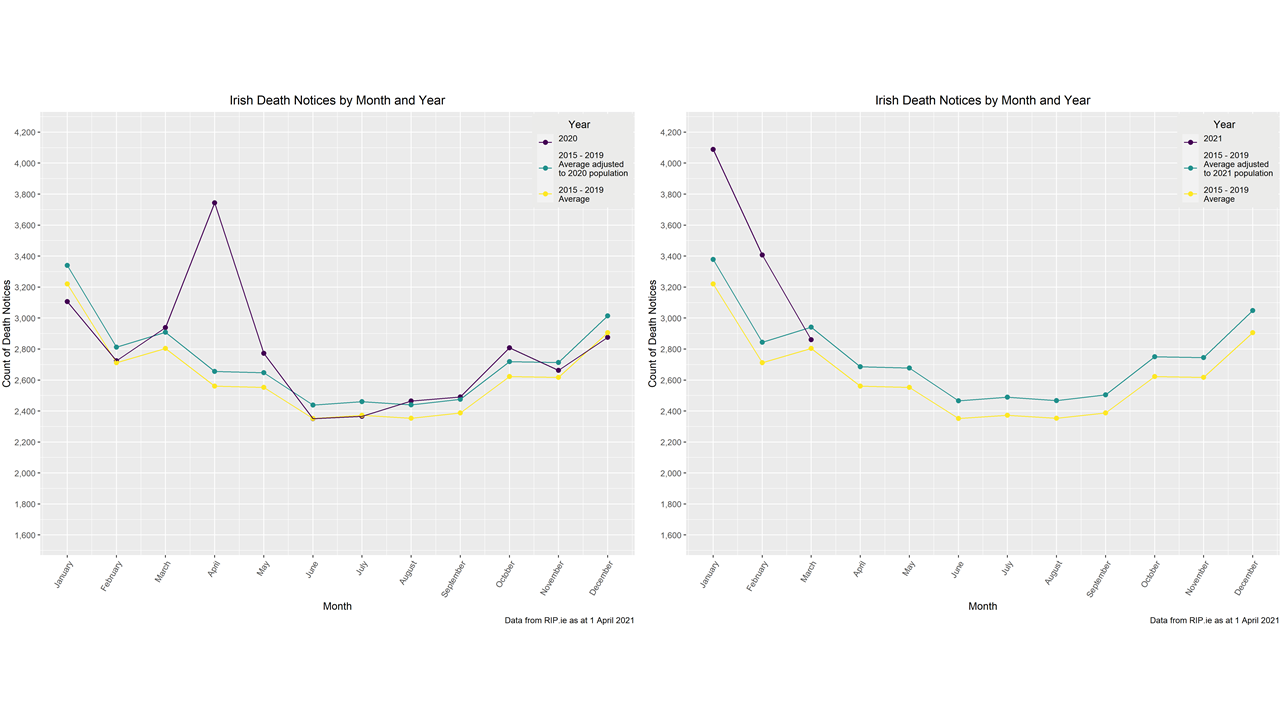
Given the nature of the population adjustment applied, it is not surprising that the shape of the expected death curve is unchanged, and the spikes of the pandemic are still clear. However, as the population has increased over the period, the level of deaths expected (in a normal year) is higher than the 2015-2019 average used in the previous analysis. Consequently, there is a reduction in the excess deaths when the adjusted expectation is considered. This can be seen more clearly in the chart below which shows excess mortality measured against the 2015-2019 average and against the population adjusted average.
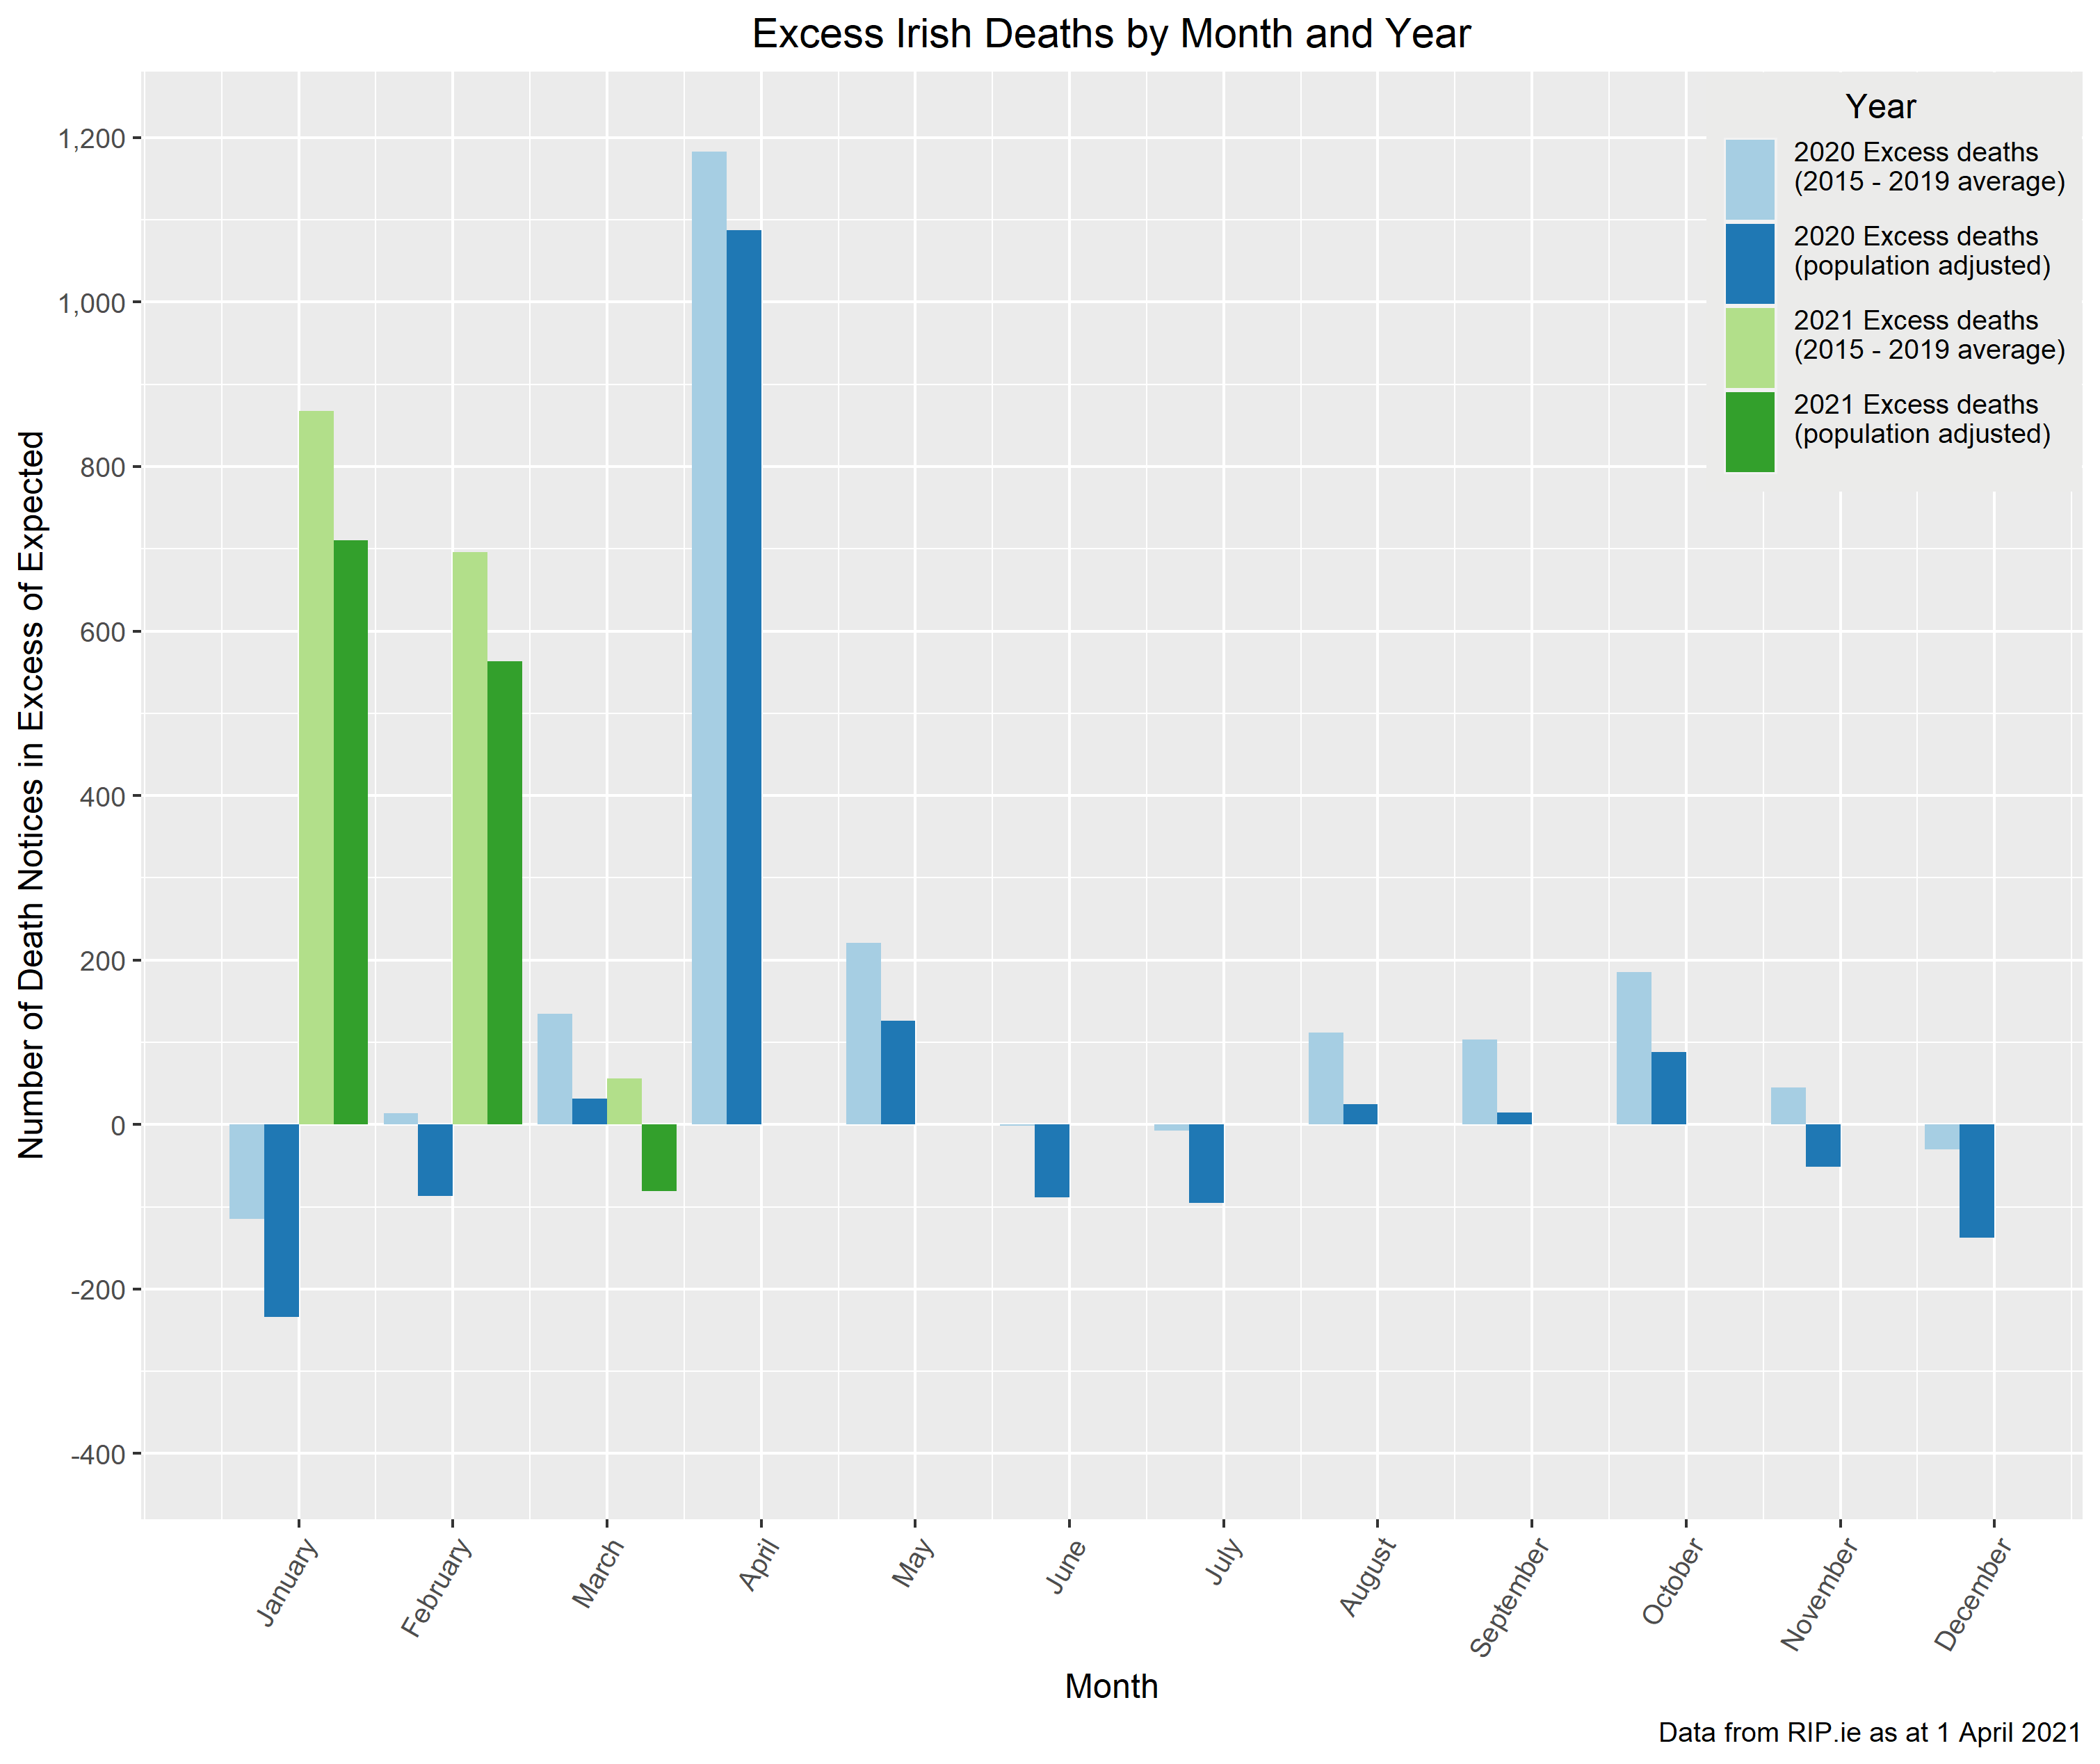
Total excess mortality in 2020 is 1,857 when measured against our standard 5-year average but only 692 when measured against the population adjusted 5-year average. The corresponding total figures for the first 3 months of 2021 are 1,619 and 1,193. However, as cautioned above, the lower excess mortality figures implied by the population-adjusted analysis do not allow for the offsetting impact of mortality improvements over the same period.
As outlined above, average population growth has been c1.2% per the CSO and this naturally has a significant dampening impact on the measurement of excess. However:
- The SAI IILMI study (2009-2015 data) showed improvements of 0.5%-1.9% for annuitant age groups and 1.7%-2.1% for insured age groups
- The SAI SAPS study (2012-2017 data) showed improvements of 2.4%-3.1% for pensioner age groups and 2.0%-2.8% for younger age groups
As both studies use an earlier data period than our excess mortality analysis (2015-2019), it is reasonable to assume that average improvements are slightly lower now and 2020/2021 improvements might be assumed zero for simplicity. Nonetheless, it could be argued from the figures above that the impact of population growth over the analysis period would be partially or potentially entirely offset by mortality improvements over the same period.
Conclusion
It is clear from the analysis above that the way in which the expected number of deaths is defined can have a significant impact on the calculated level of excess mortality observed. Every comparative we have considered, however, shows some level of excess mortality in 2020 and in the early part of 2021, despite the country being in lockdown for most of the past year and vaccinations being underway.
It is important to remember that these are not just figures, they are people and each death is a tragedy for a family. The HPSC reported 2,167 COVID deaths in 2020 and 2,503 COVID deaths in the first 3 months of 2021[5]. The fact that the level of excess deaths under all the measures we have considered is lower than the official count of COVID deaths suggests that lockdown, social distancing and improved infection prevention measures are not just reducing COVID deaths but also deaths from other causes. Without these actions, the level of excess deaths could have been a lot higher.
[1] CSO analysis considers both single year and multi-year (2 and 3 year) average
[2] CMI analysis uses an standardised single year to allow for changes in the population over time
[3] This can be impacted by factors such as a particularly cold winter, a particularly hot summer or a particularly virulent variant of seasonal flu
[4] Inter-census values are estimated by the CSO and the 2020 estimate may not fully reflect the impact of Ireland’s international workers returning to their home countries to work remotely for their Irish employers or Irish nationals returning to Ireland to either work remotely or answer Ireland’s call for health workers during the pandemic.
[5] https://covid-19.geohive.ie/datasets/d8eb52d56273413b84b0187a4e9117be_0…
COVID-19 Action Group
The views of this article do not necessarily reflect the views of the Society of Actuaries in Ireland.