Since our last update on the April 2021 data, the monthly data had shown close to “normal” levels of deaths in Ireland. The latest data for July, however, shows a recent jump in the number of deaths observed. This prompted an updated view of the Irish experience to date, which we present below.
As Ireland emerges from our restricted environment into the post-vaccine and hopefully, post COVID‑19 world, we need to keep in mind that the world as a whole is still gripped by the pandemic. With the lifting of restrictions on non-essential travel and the potential for new variants to emerge, the experience in other countries may yet impact Irish experience. As the WHO, the UN and various international health bodies have repeatedly said, no one is safe until everyone is.
In this post we present the results of our most recent analysis of experience in Ireland. Our updated results are based on data from RIP.ie to 1 August 2021 and all data processing and analysis has been undertaken in line with the approach outlined in our earlier blogs.
Analysis of deaths in Ireland
The chart below shows the number of deaths reported through RIP.ie in each month of 2020 (dark blue) and 2021 (green) against the average number reported for the same month over 2015 – 2019 (light blue). Confidence intervals of two standard deviations are included in the grey bars for perspective.

The number of deaths in April, May and June 2021 were above average but broadly followed the expected pattern for the period (i.e. the difference between the actual and expected deaths was fairly stable) but July 2021 has seen a notable rise in deaths. The data analysed for this post does not contain age so we are not able to tell whether this spike relates to age groups which were later in the vaccination programme or to heavily vaccinated age-groups. However, the spike does coincide (allowing for a c.2 week infection lag) with a some changes in Ireland:
- The vaccine programme in Ireland has progressed rapidly over the past few months with the majority of the population having received at least one dose of a vaccine by the end of June. This potentially creates a sense of security which leads people to be less careful about other preventative measures (e.g. social distancing, masks, hand washing/sanitizing).
- The period of very good weather we had in June and July which, combined with the sense of security produced by the vaccine, may have encouraged increased social interaction (although the weather presumably also encouraged more of this socialising to occur outside).
- The arrival of the Delta variant in Ireland which was confirmed in June and the potential increase in infections due to the higher transmissibility of this strain. While there is still some debate as to whether the Delta variant has a similar fatality rate as previous variants, it is reasonable to expect more cases in general might contribute to an increase in deaths.
- The lifting of various COVID restrictions in July, including restrictions on non-essential travel. Spikes were seen following previous easing of restrictions. However, assuming that the population generally adhered to the restrictions in place, the impact of this change on deaths should be dampened in July as the changes took place half way through the period, and therefore any impact on deaths is more likely to be seen in August.
Evidence from around the globe suggests that vaccines reduce the COVID cases, particularly the more severe cases. For example, with most States having lifted all COVID-related restrictions, the US provides an insight into the potential impact of vaccines post restrictions. The states with the highest vaccine take-up rates (e.g. Vermont) have the lowest levels of hospitalisations and deaths per capita and those with the lowest take up rates (e.g. Alabama) have the highest levels of hospitalisations and deaths per capita[1].
More than 70% of the Irish population[2] have received at least one dose of a vaccine so we have reason to look forward to a more “normal” future. However, the jump in deaths in July combined with the ongoing uncertainty around new variants and the impact of full reopening means hope should be coupled with caution.
Analysis by gender
The chart below shows the percentage of death notices that were male in each month of 2020 (dark blue) and 2021 (green) against the corresponding averages from 2015 – 2019 (light blue) and confidence intervals.
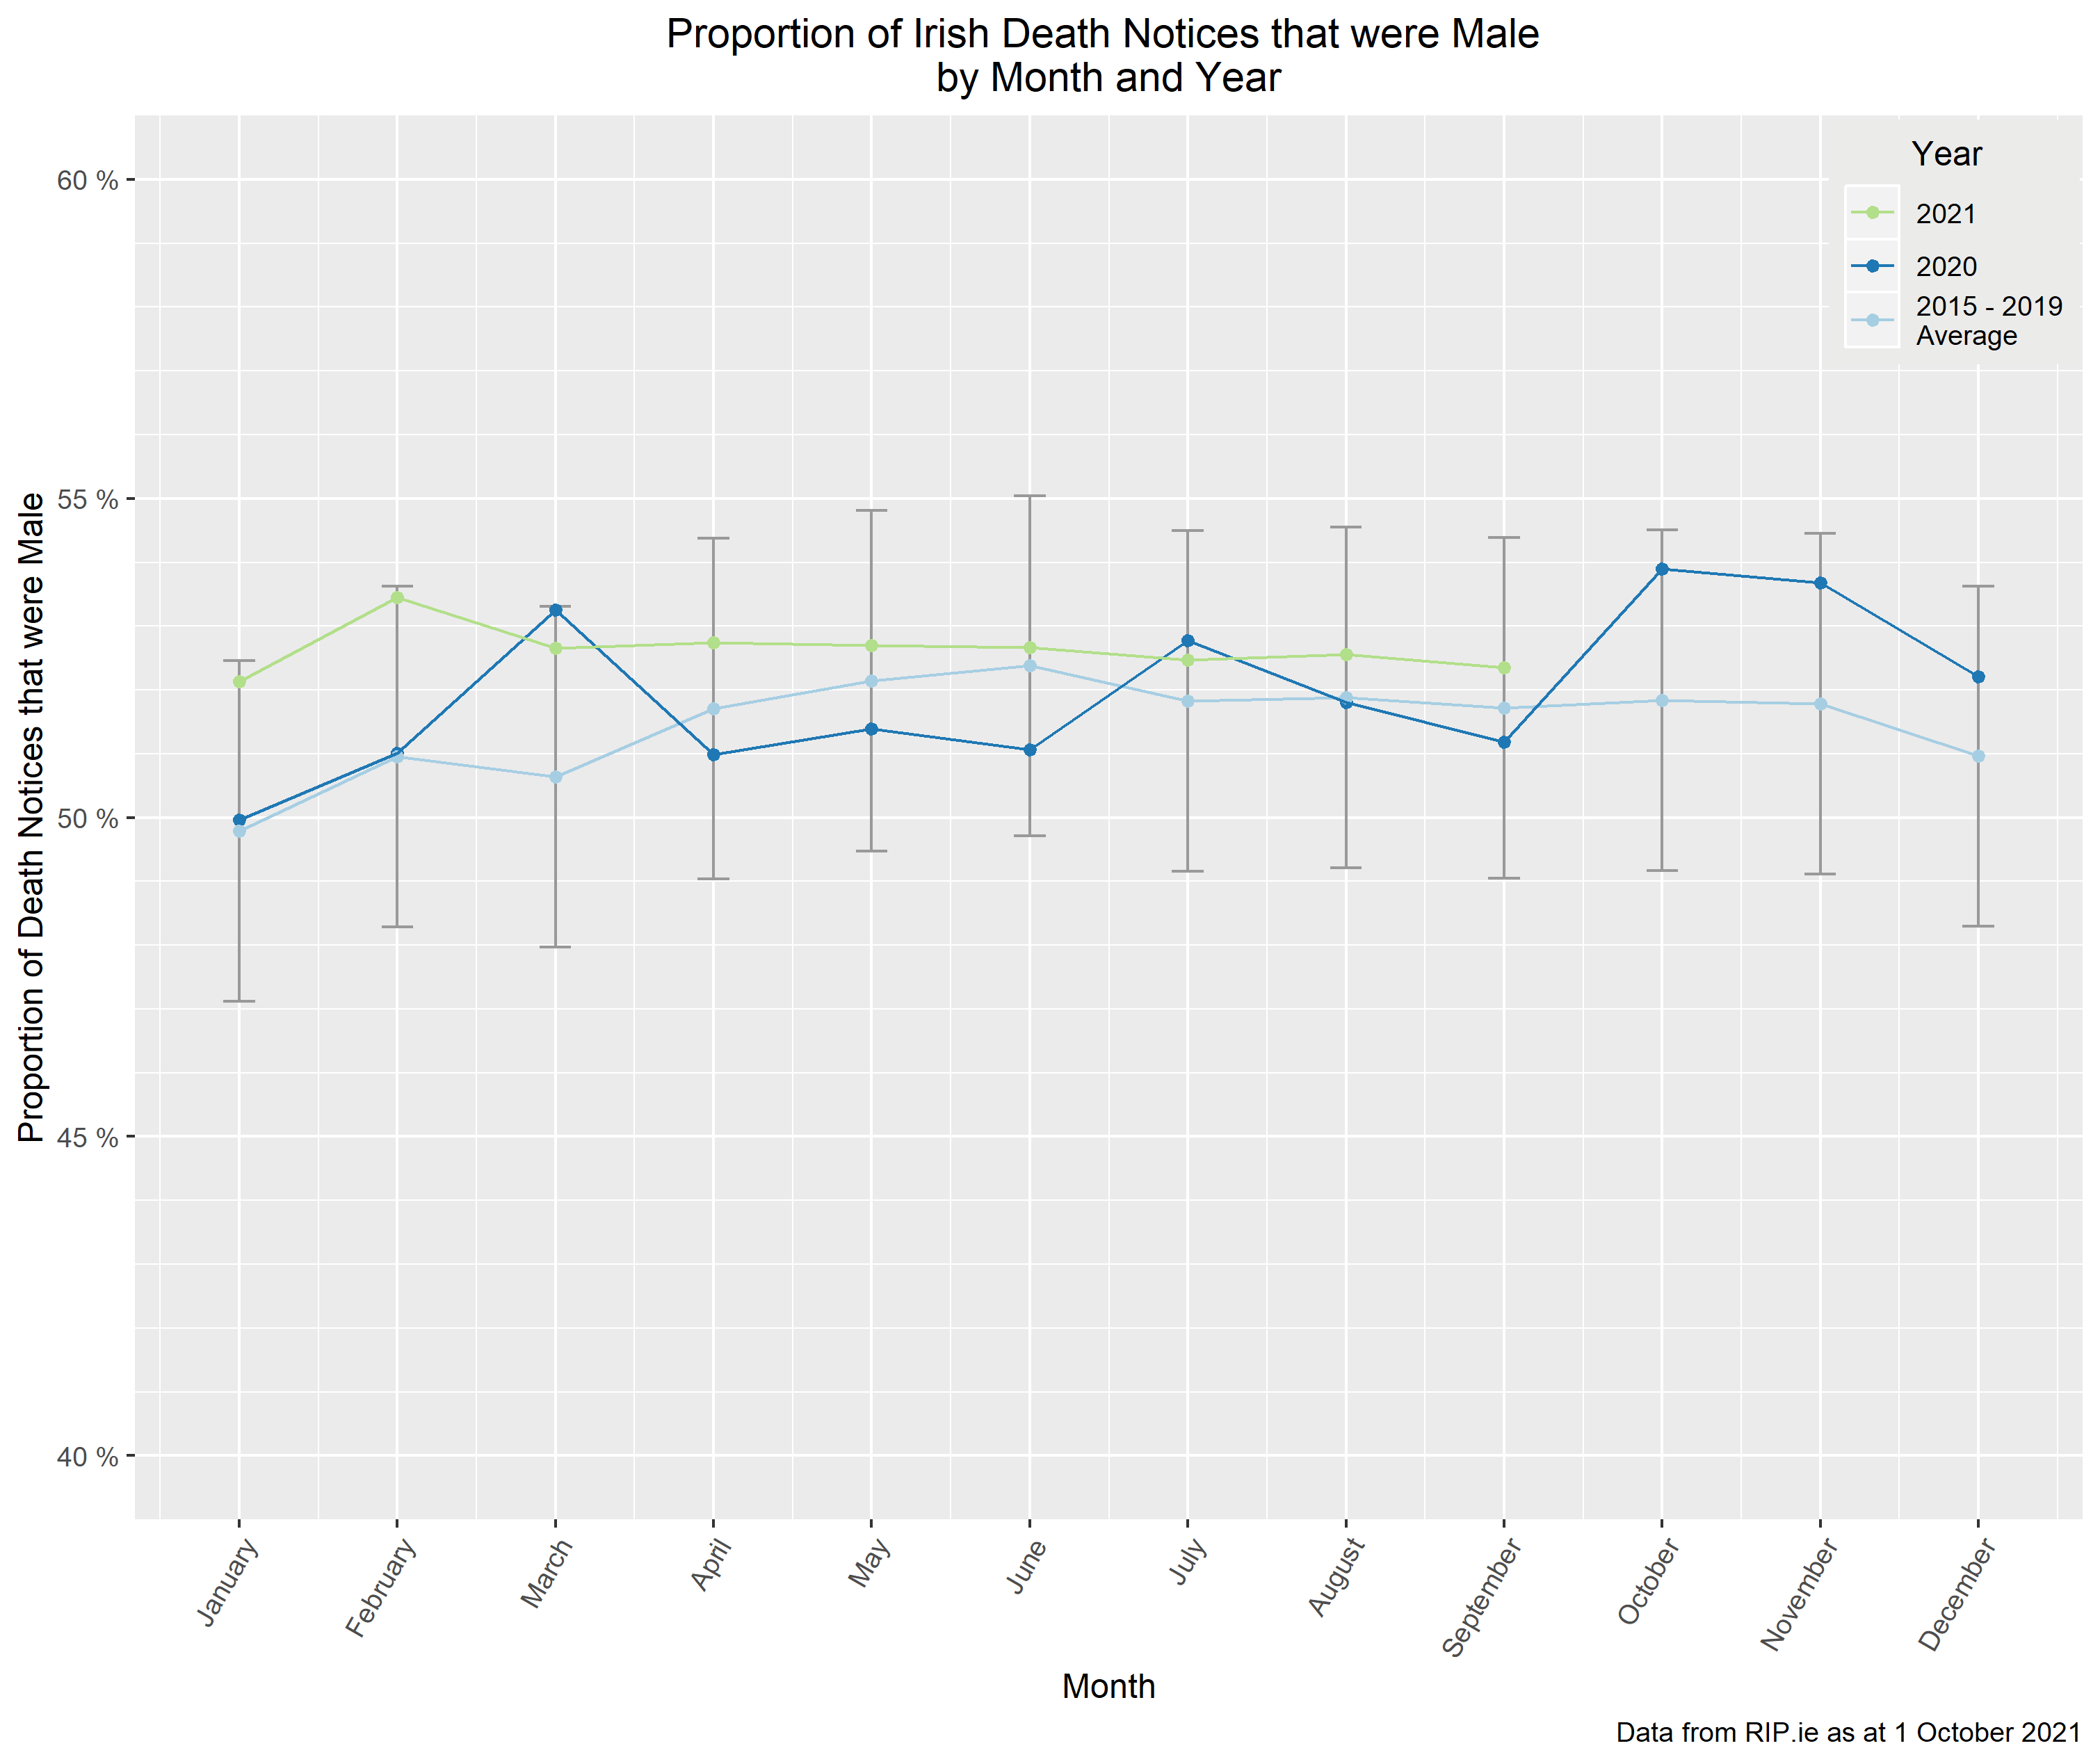
The more pronounced male bias in the second-wave deaths has persisted until March or April 2021 but has since settled at a level close to the average for this time of year. The data we have cannot tell us what has driven the reduction and stabilisation of the gender bias which was evident the second wave of COVID deaths (particularly October 2020 – March 2021). However, as this coincides with the roll-out of the vaccines, it may be that the vaccines are in some way offsetting the gender bias seen in post 14. However, it is too early and the data used in this analysis is too limited to draw any firm conclusions (i.e. the data does not include details of whether the deaths are amongst the vaccinated or unvaccinated population). It is likely that the effect observed is simply due to the vaccine reducing the risk from social interactions and moving death experience in Ireland closer to the “normal” gender balance.
County-level gender analysis
The above analysis was further examined at county level, focusing on both excess mortality and the proportion of male reported deaths from the start of the pandemic through to the end of July 2021. The following map shows the movement in the proportion of reported deaths which were male, with the excess mortality for each county in the corresponding table.

As discussed in previous posts, the experience observed in Donegal appears to be caused by a change in the way RIP.ie is used in the county rather than real experience and therefore, we have excluded it from the table. Similar features have not been observed in the other counties, so the above breakdown remains our best view of the county level impact at the current time.
Excess mortality – population adjusted
Consistent with our approach in prior posts, the analysis above has not been adjusted for changes in the population over time. However, the impact of this was explored in post 12 back in April, when we looked at different approaches to measuring excess mortality. Using the population-adjustment methodology presented in that post, the chart below which shows excess mortality measured against the 2015-2019 average and against the population adjusted average.
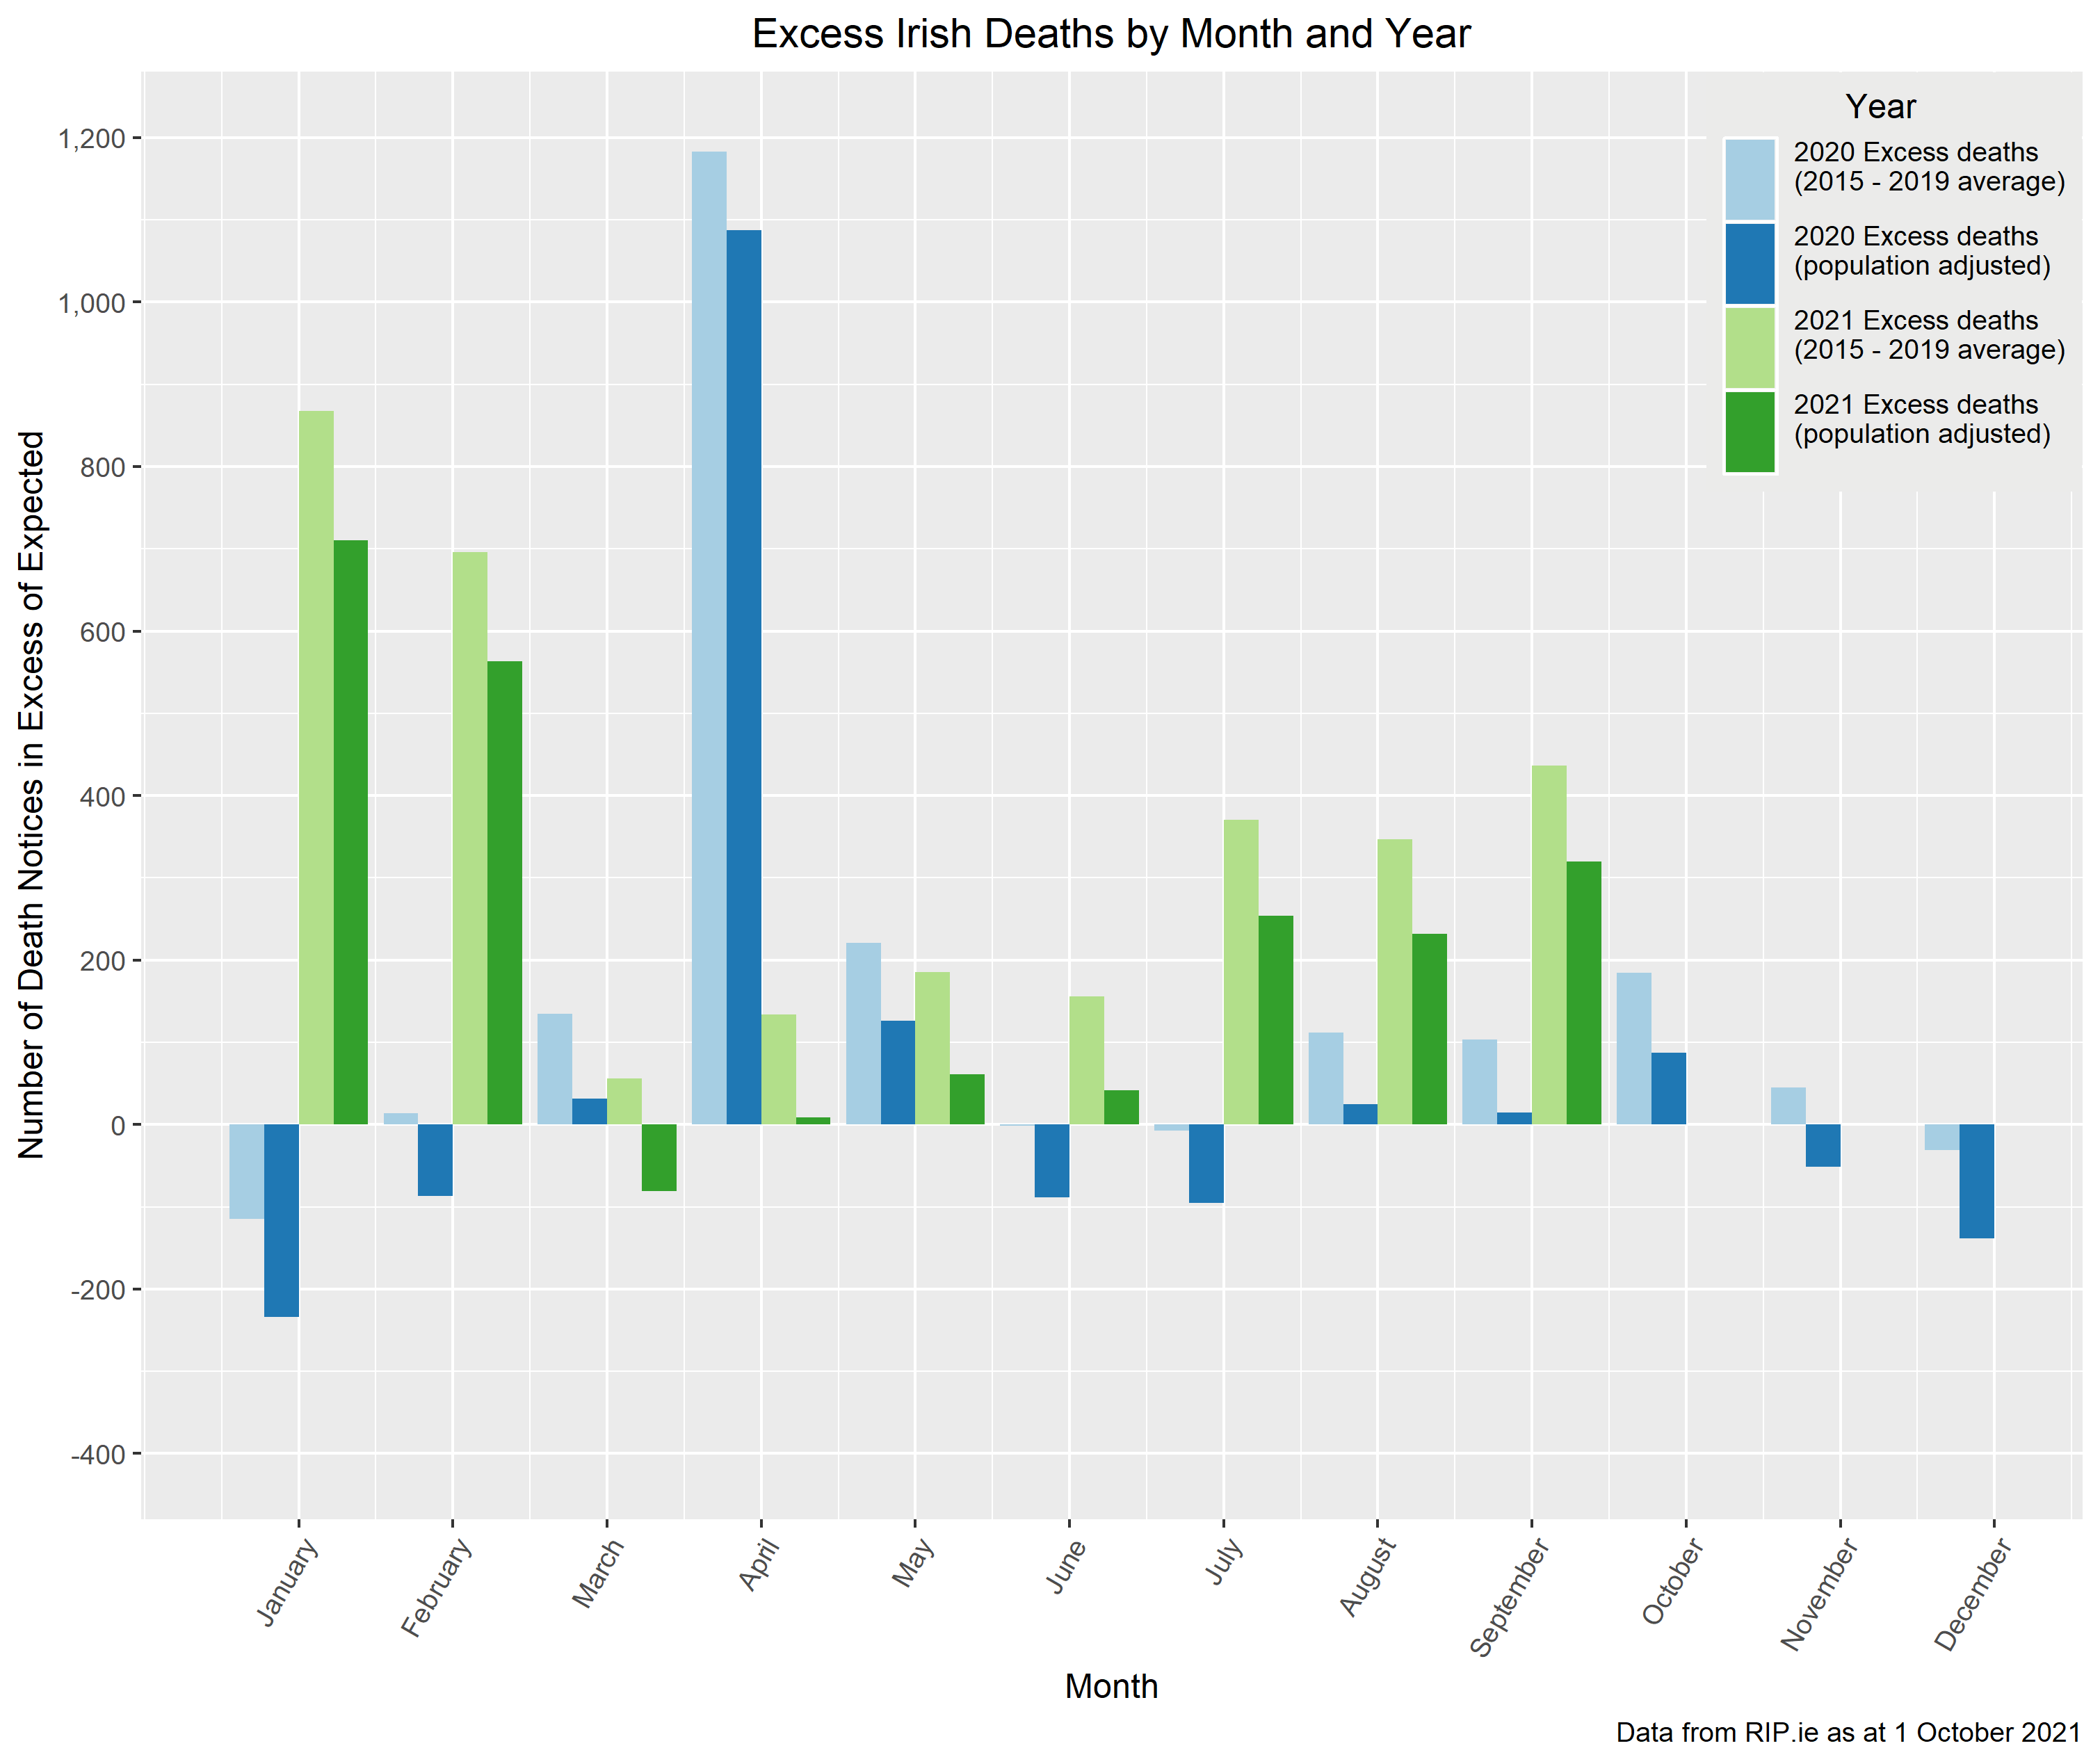
Total excess mortality in 2020 is 1,857 when measured against our standard 5-year average but reduces to 692 when measured against the population adjusted 5-year average. The corresponding total figures for the first 7 months of 2021 are 2,465 and 1,558. However, as discussed in post 12, the lower excess mortality figures implied by the population-adjusted analysis do not allow for the offsetting impact of mortality improvements over the same period, so the true excess mortality may fall between these counts.
COVID-19 Action Group
The views of this article do not necessarily reflect the views of the Society of Actuaries in Ireland.
[1] https://www.nytimes.com/interactive/2021/us/covid-cases.html
[2] https://ourworldindata.org/covid-vaccinations AND/OR https://covid-19.geohive.ie/pages/vaccinations